Nutanix Reports Second Quarter Fiscal 2019 Financial Results
--Continued Shift to Recurring Revenue Model with 57% of Billings from Subscriptions
--Subscription Revenue Up 112% YoY to $157 Million
--21% of Deals Include Offerings Beyond Core HCI 1
--Record AHV adoption of 40% 1
SAN JOSE, Calif.--(BUSINESS WIRE)-- Nutanix, Inc. (NASDAQ: NTNX), a leader in enterprise cloud computing, today announced financial results for its second quarter of fiscal 2019, ended January 31, 2019.
This press release features multimedia. View the full release here: https://www.businesswire.com/news/home/20190228005879/en/
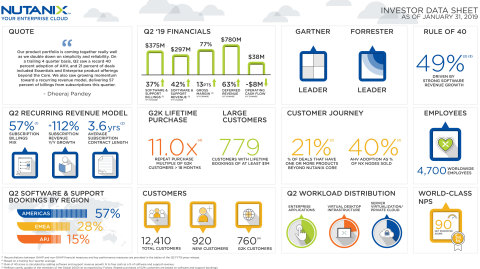
Nutanix Q2 FY19 Financial Infographic (Graphic: Business Wire)
Q2 Fiscal 2019 Financial Highlights
- Revenue: $335.4 million (at 76.8% non-GAAP gross margin), up from $286.7 million (at 63.5% non-GAAP gross margin) in the second quarter of fiscal 2018
- Billings: $413.4 million, up from $355.9 million in the second quarter of fiscal 2018
- Software and Support Revenue: $297.4 million, growing 42% year-over-year from $208.7 million in the second quarter of fiscal 2018
- Software and Support Billings: $375.5 million, growing 37% year-over-year from $274.5 million in the second quarter of fiscal 2018
- Gross Margin: GAAP gross margin of 74.4%, up from 62.2% in the second quarter of fiscal 2018; Non-GAAP gross margin of 76.8%, up from 63.5% in the second quarter of fiscal 2018
- Net Loss: GAAP net loss of $122.8 million, compared to a GAAP net loss of $62.6 million in the second quarter of fiscal 2018; Non-GAAP net loss of $40.4 million, compared to a non-GAAP net loss of $23.2 million in the second quarter of fiscal 2018
- Net Loss Per Share: GAAP net loss per share of $0.68, compared to a GAAP net loss per share of $0.39 in the second quarter of fiscal 2018; Non-GAAP net loss per share of $0.23, compared to a non-GAAP net loss per share of $0.14 in the second quarter of fiscal 2018
- Cash and Short-term Investments: $965.9 million, up from $918.3 million in the second quarter of fiscal 2018
- Deferred Revenue: $779.9 million, up 63% from the second quarter of fiscal 2018
- Operating Cash Flow: $38.5 million, compared to $46.4 million in the second quarter of fiscal 2018
- Free Cash Flow: Use of $4.1 million, compared to the generation of $32.4 million in the second quarter of fiscal 2018
Reconciliations between GAAP and non-GAAP financial measures and key performance measures are provided in the tables of this press release.
“Our product portfolio is coming together really well as we double down on simplicity and reliability. On a trailing four quarter basis, Q2 saw a record 40 percent adoption of AHV, and 21 percent of deals included Essentials and Enterprise product offerings beyond the Core,” said Dheeraj Pandey, Chairman, Founder and CEO of Nutanix. “We also saw growing momentum toward a recurring revenue model, delivering 57 percent of billings from subscriptions this quarter. And we are also pleased to announce the promotion of Chris Kaddaras to lead our sales organization in the Americas region in addition to his existing EMEA responsibilities.”
“We were pleased with our large deal activity and our progress in moving toward a subscription model,” said Duston Williams, CFO of Nutanix. “Looking ahead, our third quarter guidance reflects the impact of inadequate marketing spending for pipeline generation and slower than expected sales hiring. We took a critical look at these areas and have taken actions to address them.”
Recent Company Highlights
- Expanded Customer Base: Nutanix ended Q2 FY’19 with 12,410 end-customers, adding 920 new end-customers during the quarter. Customer wins included Apache Corporation, GS Energy Corporation, Harris Corporation, IHG, Komatsu America Corp., and Nedbank.
- Continued Momentum in $1 Million+ Customers: Our number of customers with at least $1 million in lifetime spend reached 779 during Q2 FY’19, growing 44% year-over-year. Six customers purchased at least $5 million of products and services during the quarter as they continued their datacenter modernization journey with Nutanix.
- Launched “You Decide” Campaign to Expand Brand Reach into Market: This new campaign promotes expanded customer choice in server vendor, hypervisor and cloud provider. It is designed to increase lead generation returns by highlighting the financial, operational and personal benefits of the Nutanix platform.
- Received 2018 Product of the Year for Nutanix Era: CRN honored Nutanix Era as the winner of the publication’s Hyperconverged Infrastructure category for its 2018 Product of the Year Awards. This award recognizes products and services that demonstrate best-in-breed technological innovation, financial opportunity for partners, and customer demand.
- Recognized by Forbes on its Just 100: Forbes recognized Nutanix on its Just 100 list, which honors America’s best corporate citizens among the Russell 1000 based on positive employee treatment, customer treatment and job creation.
- Named a Leader in the Gartner Magic Quadrant for Hyperconverged Infrastructure 2 : Nutanix believes its placement as a Leader for the second time in a row is strong validation of its continued dominance in the market it pioneered and its vision to deliver a true hybrid cloud experience so IT teams can seamlessly deliver applications across platforms.
Q3 Fiscal 2019 Financial Outlook
For the third quarter of fiscal 2019, Nutanix expects:
- Revenue between $290 million and $300 million;
- Billings between $360 million and $370 million;
- Non-GAAP gross margin between 75% and 76%;
- Non-GAAP operating expenses between $330 million and $340 million; and
- Non-GAAP net loss per share of approximately $0.60, using approximately 183 million weighted shares outstanding
1Based on a trailing four-quarter average.
2The Gartner reference(s) described herein, (the "Gartner Reference(s)") represent(s) research opinion or viewpoints published, as part of a syndicated subscription service, by Gartner, Inc. ("Gartner"), and are not representations of fact. Each Gartner Reference speaks as of its original publication date (and not as of the date of this press release) and the opinions expressed in the Gartner Reference(s) are subject to change without notice. Gartner does not endorse any vendor, product or service depicted in its research publications, and does not advise technology users to select only those vendors with the highest ratings or other designation. Gartner research publications consist of the opinions of Gartner's research organization and should not be construed as statements of fact. Gartner disclaims all warranties, expressed or implied, with respect to this research, including any warranties of merchantability or fitness for a particular purpose.
Supplementary materials to this earnings release, including the company’s second quarter fiscal 2019 investor presentation, can be found at https://ir.nutanix.com/company/financial.
All forward-looking non-GAAP financial measures contained in the section titled "Q3 Fiscal 2019 Financial Outlook" exclude stock-based compensation expense and amortization of intangible assets and may also exclude, as applicable, other special items. The company has not reconciled guidance for billings, non-GAAP gross margin, non-GAAP operating expenses and non-GAAP loss per share to their most directly comparable GAAP measures because such items that impact these measures are not within its control and are subject to constant change. While the actual amounts of such items will have a significant impact on the company’s billings, non-GAAP gross margin, non-GAAP operating expenses and non-GAAP loss per share, a reconciliation of the non-GAAP financial measure guidance to the corresponding GAAP measures is not available without unreasonable effort.
Webcast and Conference Call Information
Nutanix executives will discuss the company’s second quarter fiscal 2019 financial results on a conference call at 4:30 p.m. Eastern Time/1:30 p.m. Pacific Time today. To listen to the call via telephone, dial 1-833-227-5841 in the United States or 1-647-689-4068 from outside the United States. The conference ID is 6887822. This call will be webcast live and available to all interested parties on our Investor Relations website at ir.nutanix.com. Shortly after the conclusion of the conference call, a replay of the audio webcast will be available on the Nutanix Investor Relations website. A telephonic replay will be available for one week by calling 1-800-585-8367 or 1-416-621-4642, and entering the conference ID 6887822.
Non-GAAP Financial Measures and Other Key Performance Measures
To supplement our condensed consolidated financial statements, which are prepared and presented in accordance with GAAP, we use the following non-GAAP financial and other key performance measures: billings, non-GAAP gross margin, non-GAAP operating expenses, non-GAAP net loss, non-GAAP net loss per share, free cash flow, software and support revenue, software and support billings, and subscription and professional services billings. In computing these non-GAAP financial measures and key performance measures, we exclude certain items such as stock-based compensation and the related income tax impact, costs associated with our acquisitions (such as amortization of acquired intangible assets, revaluation of contingent consideration, income tax-related impact, and other acquisition-related costs), amortization of debt discount and issuance costs, other non-recurring transactions and the related tax impact, and the revenue and billings associated with pass-through hardware sales. Billings is a performance measure which our management believes provides useful information to investors because it represents the amounts under binding purchase orders received by us during a given period that have been billed, and we calculate billings by adding the change in deferred revenue between the start and end of the period to total revenue recognized in the same period. Free cash flow is a performance measure that our management believes provides useful information to management and investors about the amount of cash generated by the business after necessary capital expenditures, and we define free cash flow as net cash (used in) provided by operating activities less purchases of property and equipment. Non-GAAP gross margin, non-GAAP operating expenses, non-GAAP net loss, and non-GAAP net loss per share are financial measures which our management believes provide useful information to investors because they provide meaningful supplemental information regarding our performance and liquidity by excluding certain expenses and expenditures such as stock-based compensation expense that may not be indicative of our ongoing core business operating results. Software and support revenue and software and support billings are performance measures that our management believes provide useful information to our management and investors as it allows us to better track the true growth of our software business by excluding the amounts attributable to the pass-through hardware sales that we use to deliver our solutions. Subscription and professional services billings are performance measures that our management believes provide useful information to our management and investors as it allows us to better track the growth of the subscription-based portion of our business, which is a critical part of our business plan. We use these non-GAAP financial and key performance measures for financial and operational decision-making and as a means to evaluate period-to-period comparisons. However, these non-GAAP financial and key performance measures have limitations as analytical tools and you should not consider them in isolation or as substitutes for analysis of our results as reported under GAAP. Billings, non-GAAP gross margin, non-GAAP operating expenses, non-GAAP net loss, non-GAAP net loss per share, and free cash flow are not substitutes for total revenue, gross margin, operating expenses, net loss, net loss per share, or net cash (used in) provided by operating activities, respectively, software and support revenue and software and support billings are not substitutes for total revenue, and subscription and professional services billings are not a substitute for subscription and professional services revenue. In addition, other companies, including companies in our industry, may calculate non-GAAP financial measures and key performance measures differently or may use other measures to evaluate their performance, all of which could reduce the usefulness of our non-GAAP financial measures and key performance measures as tools for comparison. We urge you to review the reconciliation of our non-GAAP financial measures and key performance measures to the most directly comparable GAAP financial measures included below in the tables captioned “Reconciliation of Revenue to Billings,” “Disaggregation of Revenue and Billings,” “Reconciliation of Subscription and Professional Services Revenue to Subscription and Professional Services Billings,” “Reconciliation of Software and Support Revenue to Software and Support Billings,” “Reconciliation of GAAP to Non-GAAP Profit Measures,” and “Reconciliation of GAAP Net Cash Provided By Operating Activities to Non-GAAP Free Cash Flow,” and not to rely on any single financial measure to evaluate our business.
Forward-Looking Statements
This press release contains express and implied forward-looking statements, including, but not limited to, statements regarding our business plans and objectives, the benefits and capabilities of our platform, products, services and technology, our continued investment in talent, technology, and marketing, our plans and timing for, and the success and impact of, our transition to a subscription-based and recurring revenue business model, any impact of the actions we have undertaken to address inadequate marketing spending for pipeline generation and slower than expected sales hiring, and anticipated future financial results, including but not limited to our guidance on estimated revenues, billings, non-GAAP gross margin, non-GAAP operating expenses and non-GAAP net loss per share for future fiscal periods. These forward-looking statements are not historical facts and instead are based on our current expectations, estimates, opinions, and beliefs. Consequently, you should not rely on these forward-looking statements. The accuracy of such forward-looking statements depends upon future events and involves risks, uncertainties, and other factors beyond our control that may cause these statements to be inaccurate and cause our actual results, performance or achievements to differ materially and adversely from those anticipated or implied by such statements, including, among others: failure to develop, or unexpected difficulties or delays in developing, new products, services, product features or technology in a timely or cost-effective basis; delays in or lack of customer or market acceptance of our new products, services, product features or technology; delays in the transition to focus primarily on software-only transactions and a subscription-based and recurring revenue business model; failure of the actions we have undertaken to address inadequate marketing spending for pipeline generation and slower than expected sales hiring to yield the results we expect; the rapid evolution of the markets in which we compete; our ability to sustain or manage future growth effectively; factors that could result in the significant fluctuation of our future quarterly operating results, including, among other things, anticipated changes to our revenue and product mix which will slow revenue growth during such transition and make forecasting future performance more difficult, the timing and magnitude of orders, shipments and acceptance of our solutions in any given quarter, our ability to attract new and retain existing end-customers, changes in the pricing of certain components of our solutions, and fluctuations in demand and competitive pricing pressures for our solutions; the introduction, or acceleration of adoption of, competing solutions, including public cloud infrastructure; and other risks detailed in our quarterly report on Form 10-Q for the fiscal quarter ended October 31, 2018, filed with the SEC on December 10, 2018. Additional information will also be set forth in our Form 10-Q that will be filed for the quarter ended January 31, 2019, which should be read in conjunction with these financial results. Our SEC filings are available on the Investor Relations section of the company’s website at ir.nutanix.com and on the SEC's website at www.sec.gov. These forward-looking statements speak only as of the date of this press release and, except as required by law, we assume no obligation to update forward-looking statements to reflect actual results or subsequent events or circumstances.
About Nutanix
Nutanix is a global leader in cloud software and hyperconverged infrastructure solutions, making infrastructure invisible so that IT can focus on the applications and services that power their business. Companies around the world use Nutanix Enterprise Cloud OS platform to bring one-click application management and mobility across public, private and distributed edge clouds so they can run any application at any scale with a dramatically lower total cost of ownership. The result is organizations that can rapidly deliver a high-performance IT environment on demand, giving application owners a true cloud-like experience. Learn more at www.nutanix.com or follow us on Twitter @nutanix.
© 2019 Nutanix, Inc. All rights reserved. Nutanix, the Nutanix logo, Nutanix Era, and all product and service names mentioned herein are registered trademarks or trademarks of Nutanix, Inc. in the United States and other countries. All other brand names mentioned herein are for identification purposes only and may be the trademarks of their respective holder(s).
|
NUTANIX, INC. |
||||||||||
|
CONDENSED CONSOLIDATED BALANCE SHEETS |
||||||||||
|
(Unaudited) |
||||||||||
| As of | ||||||||||
| July 31, 2018 |
January 31, 2019 |
|||||||||
| (in thousands) | ||||||||||
| Assets | ||||||||||
| Current assets: | ||||||||||
| Cash and cash equivalents | $ | 305,975 | $ | 466,010 | ||||||
| Short-term investments | 628,328 | 499,915 | ||||||||
| Accounts receivable, net | 258,289 | 247,600 | ||||||||
| Deferred commissions—current | 33,691 | 36,934 | ||||||||
| Prepaid expenses and other current assets | 36,818 | 49,456 | ||||||||
| Total current assets | 1,263,101 | 1,299,915 | ||||||||
| Property and equipment, net | 85,111 | 125,924 | ||||||||
| Deferred commissions—non-current | 80,688 | 93,100 | ||||||||
| Intangible assets, net | 45,366 | 75,473 | ||||||||
| Goodwill | 87,759 | 184,819 | ||||||||
| Other assets—non-current | 37,855 | 41,907 | ||||||||
| Total assets | $ | 1,599,880 | $ | 1,821,138 | ||||||
| Liabilities and Stockholders’ Equity | ||||||||||
| Current liabilities: | ||||||||||
| Accounts payable | $ | 65,503 | $ | 69,045 | ||||||
| Accrued compensation and benefits | 85,398 | 86,460 | ||||||||
| Accrued expenses and other current liabilities | 31,682 | 16,424 | ||||||||
| Deferred revenue—current | 275,648 | 337,424 | ||||||||
| Total current liabilities | 458,231 | 509,353 | ||||||||
| Deferred revenue—non-current | 355,559 | 442,435 | ||||||||
| Convertible senior notes, net | 429,598 | 444,012 | ||||||||
| Other liabilities—non-current | 29,713 | 39,807 | ||||||||
| Total liabilities | 1,273,101 | 1,435,607 | ||||||||
| Stockholders’ equity: | ||||||||||
| Common stock | 4 | 4 | ||||||||
| Additional paid-in capital | 1,355,907 | 1,630,834 | ||||||||
| Accumulated other comprehensive loss | (1,002 | ) | (149 | ) | ||||||
| Accumulated deficit | (1,028,130 | ) | (1,245,158 | ) | ||||||
| Total stockholders’ equity | 326,779 | 385,531 | ||||||||
| Total liabilities and stockholders’ equity | $ | 1,599,880 | $ | 1,821,138 | ||||||
|
NUTANIX, INC. |
||||||||||||||||||||
|
CONDENSED CONSOLIDATED STATEMENTS OF OPERATIONS |
||||||||||||||||||||
|
(Unaudited) |
||||||||||||||||||||
| Three Months Ended January 31, |
Six Months Ended January 31, |
|||||||||||||||||||
| 2018 | 2019 | 2018 | 2019 | |||||||||||||||||
| (in thousands, except share and per share data) | ||||||||||||||||||||
| Revenue: | ||||||||||||||||||||
| Product | $ | 223,170 | $ | 236,932 | $ | 442,222 | $ | 461,278 | ||||||||||||
| Support, entitlements and other services | 63,574 | 98,428 | 120,074 | 187,365 | ||||||||||||||||
| Total revenue | 286,744 | 335,360 | 562,296 | 648,643 | ||||||||||||||||
| Cost of revenue: | ||||||||||||||||||||
| Product (1)(2) | 83,217 | 45,966 | 168,379 | 85,227 | ||||||||||||||||
| Support, entitlements and other services (1) | 25,311 | 40,016 | 48,771 | 74,861 | ||||||||||||||||
| Total cost of revenue | 108,528 | 85,982 | 217,150 | 160,088 | ||||||||||||||||
| Gross profit | 178,216 | 249,378 | 345,146 | 488,555 | ||||||||||||||||
| Operating expenses: | ||||||||||||||||||||
| Sales and marketing (1)(2) | 151,201 | 213,707 | 296,606 | 410,204 | ||||||||||||||||
| Research and development (1) | 70,924 | 123,037 | 135,436 | 233,568 | ||||||||||||||||
| General and administrative (1) | 15,948 | 28,788 | 32,000 | 56,127 | ||||||||||||||||
| Total operating expenses | 238,073 | 365,532 | 464,042 | 699,899 | ||||||||||||||||
| Loss from operations | (59,857 | ) | (116,154 | ) | (118,896 | ) | (211,344 | ) | ||||||||||||
| Other expense, net | (861 | ) | (4,399 | ) | (1,050 | ) | (7,102 | ) | ||||||||||||
| Loss before provision for (benefit from) income taxes | (60,718 | ) | (120,553 | ) | (119,946 | ) | (218,446 | ) | ||||||||||||
| Provision for (benefit from) income taxes | 1,913 | 2,210 | 4,172 | (1,418 | ) | |||||||||||||||
| Net loss | $ | (62,631 | ) | $ | (122,763 | ) | $ | (124,118 | ) | $ | (217,028 | ) | ||||||||
| Net loss per share attributable to Class A and Class B common stockholders—basic and diluted | $ | (0.39 | ) | $ | (0.68 | ) | $ | (0.78 | ) | $ | (1.22 | ) | ||||||||
| Weighted average shares used in computing net loss per share attributable to Class A and Class B common stockholders—basic and diluted | 161,737,428 | 179,444,648 | 159,251,964 | 177,428,029 | ||||||||||||||||
|
_____________________ |
|||
| (1) | Includes the following stock-based compensation expense: | ||
| Three Months Ended January 31, |
Six Months Ended January 31, |
||||||||||||||||||
| 2018 | 2019 | 2018 | 2019 | ||||||||||||||||
| (in thousands) | |||||||||||||||||||
| Product cost of revenue | $ | 684 | $ | 872 | $ | 1,254 | $ | 1,570 | |||||||||||
| Support, entitlements and other services cost of revenue | 2,133 | 3,373 | 4,205 | 6,530 | |||||||||||||||
| Sales and marketing | 15,942 | 23,462 | 29,708 | 46,068 | |||||||||||||||
| Research and development | 17,023 | 34,679 | 32,565 | 65,688 | |||||||||||||||
| General and administrative | 6,229 | 10,179 | 9,794 | 18,634 | |||||||||||||||
| Total stock-based compensation expense | $ | 42,011 | $ | 72,565 | $ | 77,526 | $ | 138,490 | |||||||||||
|
_____________________ |
|||
| (2) | Includes the following amortization of intangible assets: | ||
| Three Months Ended January 31, |
Six Months Ended January 31, |
||||||||||||||||||
| 2018 | 2019 | 2018 | 2019 | ||||||||||||||||
| (in thousands) | |||||||||||||||||||
| Product cost of sales | $ | 1,164 | $ | 3,692 | $ | 2,059 | $ | 6,860 | |||||||||||
| Sales and marketing | 192 | 666 | 403 | 1,216 | |||||||||||||||
| Total amortization of intangible assets | $ | 1,356 | $ | 4,358 | $ | 2,462 | $ | 8,076 | |||||||||||
|
NUTANIX, INC. |
||||||||||
|
CONDENSED CONSOLIDATED STATEMENTS OF CASH FLOWS |
||||||||||
|
(Unaudited) |
||||||||||
| Six Months Ended January 31, |
||||||||||
| 2018 | 2019 | |||||||||
| (in thousands) | ||||||||||
| Cash flows from operating activities: | ||||||||||
| Net loss | $ | (124,118 | ) | $ | (217,028 | ) | ||||
| Adjustments to reconcile net loss to net cash provided by operating activities: | ||||||||||
| Depreciation and amortization | 23,015 | 35,005 | ||||||||
| Stock-based compensation | 77,526 | 138,490 | ||||||||
| Amortization of debt discount and debt issuance costs | 738 | 14,415 | ||||||||
| Change in fair value of contingent consideration | (3,955 | ) | (795 | ) | ||||||
| Other | 141 | (1,121 | ) | |||||||
| Changes in operating assets and liabilities: | ||||||||||
| Accounts receivable, net | (490 | ) | 13,579 | |||||||
| Deferred commissions | (26,101 | ) | (15,655 | ) | ||||||
| Prepaid expenses and other assets (1) | (2,832 | ) | (16,495 | ) | ||||||
| Accounts payable | (16,560 | ) | 7,554 | |||||||
| Accrued compensation and benefits | 17,789 | 1,062 | ||||||||
| Accrued expenses and other liabilities | 2,415 | (19,029 | ) | |||||||
| Deferred revenue | 108,944 | 148,332 | ||||||||
| Net cash provided by operating activities (1) | 56,512 | 88,314 | ||||||||
| Cash flows from investing activities: | ||||||||||
| Maturities of investments | 84,927 | 297,596 | ||||||||
| Purchases of investments | (183,102 | ) | (167,066 | ) | ||||||
| Purchases of property and equipment | (31,993 | ) | (72,383 | ) | ||||||
| Payment for an acquisition, net of cash and restricted cash acquired | — | (18,662 | ) | |||||||
| Net cash (used in) provided by investing activities | (130,168 | ) | 39,485 | |||||||
| Cash flows from financing activities: | ||||||||||
| Proceeds from sales of shares through employee equity incentive plans, net of repurchases | 36,819 | 33,364 | ||||||||
| Payment of debt in conjunction with an acquisition | — | (991 | ) | |||||||
| Proceeds from issuance of convertible senior notes, net | 564,219 | (75 | ) | |||||||
| Proceeds from issuance of warrants | 87,975 | — | ||||||||
| Payments for the cost of convertible note hedges | (143,175 | ) | — | |||||||
| Payments of offering costs | (85 | ) | — | |||||||
| Net cash provided by financing activities | 545,753 | 32,298 | ||||||||
| Net increase in cash, cash equivalents and restricted cash (1) | $ | 472,097 | $ | 160,097 | ||||||
| Cash, cash equivalents and restricted cash—beginning of period (1) | 139,497 | 307,098 | ||||||||
| Cash, cash equivalents and restricted cash—end of period (1) | $ | 611,594 | $ | 467,195 | ||||||
| Restricted cash (1) (2) | 1,148 | 1,185 | ||||||||
| Cash and cash equivalents—end of period | $ | 610,446 | $ | 466,010 | ||||||
| Supplemental disclosures of cash flow information: | ||||||||||
| Cash paid for income taxes | $ | 4,077 | $ | 24,023 | ||||||
| Supplemental disclosures of non-cash investing and financing information: | ||||||||||
| Issuance of common stock for business combinations | $ | — | $ | 102,978 | ||||||
| Purchases of property and equipment included in accounts payable and accrued liabilities | $ | 4,673 | $ | 9,026 | ||||||
| Vesting of early exercised stock options | $ | 435 | $ | 120 | ||||||
| Convertible notes issuance costs included in accounts payable and accrued liabilities | $ | 707 | $ | — | ||||||
|
_____________________ |
|||
| (1) | During the first quarter of fiscal 2019, we adopted Accounting Standards Update (ASU) No. 2016-18, which requires that the statement of cash flows explain the change during the period in the total of cash, cash equivalents and restricted cash. We adopted the standard retrospectively for the prior period presented. Our adoption of ASU 2016-18 did not have any significant impact on our consolidated statement of cash flows. | ||
| (2) | Included within other assets—non-current in the condensed consolidated balance sheets. | ||
|
NUTANIX, INC. |
|||||||||||||||||||
|
Reconciliation of Revenue to Billings |
|||||||||||||||||||
|
(Unaudited) |
|||||||||||||||||||
| Three Months Ended January 31, |
Six Months Ended January 31, |
||||||||||||||||||
| 2018 | 2019 | 2018 | 2019 | ||||||||||||||||
| (in thousands) | |||||||||||||||||||
| Total revenue | $ | 286,744 | $ | 335,360 | $ | 562,296 | $ | 648,643 | |||||||||||
| Change in deferred revenue, net of acquisitions (1) | 69,156 | 78,059 | 108,944 | 148,332 | |||||||||||||||
| Total billings | $ | 355,900 | $ | 413,419 | $ | 671,240 | $ | 796,975 | |||||||||||
|
_____________________ |
|||
| (1) | Amount for the six months ended January 31, 2019 excludes approximately $0.3 million of deferred revenue assumed in the Frame acquisition. | ||
|
Disaggregation of Revenue and Billings |
|||||||||||||||||||
|
(Unaudited) |
|||||||||||||||||||
| Three Months Ended January 31, |
Six Months Ended January 31, |
||||||||||||||||||
| 2018 | 2019 | 2018 | 2019 | ||||||||||||||||
| (in thousands) | |||||||||||||||||||
| Disaggregation of Revenue: | |||||||||||||||||||
| Subscription | $ | 74,187 | $ | 157,356 | $ | 136,563 | $ | 284,332 | |||||||||||
| Non-portable software | 129,210 | 131,621 | 256,107 | 278,191 | |||||||||||||||
| Hardware | 77,999 | 37,919 | 158,837 | 70,466 | |||||||||||||||
| Professional services | 5,348 | 8,464 | 10,789 | 15,654 | |||||||||||||||
| Total revenue | $ | 286,744 | $ | 335,360 | $ | 562,296 | $ | 648,643 | |||||||||||
| Disaggregation of Billings: | |||||||||||||||||||
| Subscription | $ | 136,577 | $ | 233,616 | $ | 235,479 | $ | 428,380 | |||||||||||
| Non-portable software | 130,997 | 131,621 | 257,894 | 278,191 | |||||||||||||||
| Hardware | 81,387 | 37,919 | 162,225 | 70,466 | |||||||||||||||
| Professional services | 6,939 | 10,263 | 15,642 | 19,938 | |||||||||||||||
| Total billings | $ | 355,900 | $ | 413,419 | $ | 671,240 | $ | 796,975 | |||||||||||
Subscription — Subscription revenue is generated from the sales of software entitlement and support subscriptions, separately purchased software term-based licenses and cloud-based Software as a Service, or SaaS offerings. We recognize revenue from software entitlement and support subscriptions and SaaS offerings ratably over the contractual service period, while revenue from our separately purchased software term-based licenses is generally recognized upon transfer of control to the customer, which is when we make the software available to our customers.
Non-portable software — Non-portable software revenue includes sales of our software operating system when delivered on a configured to order appliance by us, or one of our OEM partners. The software licenses associated with these sales are typically non-portable and have a term equal to the life of the appliance it is delivered on. Revenue from our non-portable software products is generally recognized upon transfer of control to the customer.
Hardware — In transactions where we deliver the hardware appliance, we consider ourselves to be the principal in the transaction and we record revenue and costs of goods sold on a gross basis. We consider the amount allocated to hardware revenue to be equivalent to the cost of the hardware procured. Hardware revenue is generally recognized upon transfer of control to the customer.
Professional services — We also sell professional services with our products. We recognize revenue related to professional services as they are performed.
|
NUTANIX, INC. |
|||||||||||||||||||
|
Reconciliation of Subscription and Professional Services Revenue to Subscription and Professional Services Billings |
|||||||||||||||||||
|
(Unaudited) |
|||||||||||||||||||
| Three Months Ended January 31, |
Six Months Ended January 31, |
||||||||||||||||||
| 2018 | 2019 | 2018 | 2019 | ||||||||||||||||
| (in thousands) | |||||||||||||||||||
| Subscription revenue | $ | 74,187 | $ | 157,356 | $ | 136,563 | $ | 284,332 | |||||||||||
| Change in subscription deferred revenue, net of acquisitions (1) | 62,390 | 76,260 | 98,916 | 144,048 | |||||||||||||||
| Subscription billings | $ | 136,577 | $ | 233,616 | $ | 235,479 | $ | 428,380 | |||||||||||
| Professional services revenue | $ | 5,348 | $ | 8,464 | $ | 10,789 | $ | 15,654 | |||||||||||
| Change in professional services deferred revenue | 1,591 | 1,799 | 4,853 | 4,284 | |||||||||||||||
| Professional services billings | $ | 6,939 | $ | 10,263 | $ | 15,642 | $ | 19,938 | |||||||||||
|
_____________________ |
|||
| (1) | Amount for the six months ended January 31, 2019 excludes approximately $0.3 million of deferred revenue assumed in the Frame acquisition. | ||
|
Reconciliation of Software and Support Revenue to Software and Support Billings |
|||||||||||||||||||
|
(Unaudited) |
|||||||||||||||||||
| Three Months Ended January 31, |
Six Months Ended January 31, |
||||||||||||||||||
| 2018 | 2019 | 2018 | 2019 | ||||||||||||||||
| (in thousands) | |||||||||||||||||||
| Software revenue | $ | 145,171 | $ | 199,013 | $ | 283,385 | $ | 390,812 | |||||||||||
| Hardware revenue | 77,999 | 37,919 | 158,837 | 70,466 | |||||||||||||||
| Product revenue | 223,170 | 236,932 | 442,222 | 461,278 | |||||||||||||||
| Support, entitlements and other services revenue | 63,574 | 98,428 | 120,074 | 187,365 | |||||||||||||||
| Total revenue | $ | 286,744 | $ | 335,360 | $ | 562,296 | $ | 648,643 | |||||||||||
| Total software and support revenue (3) | $ | 208,745 | $ | 297,441 | $ | 403,459 | $ | 578,177 | |||||||||||
| Change in software and support deferred revenue, net of acquisitions (1)(2) | 65,765 | 78,059 | 105,553 | 148,332 | |||||||||||||||
| Software and support billings (3) | $ | 274,510 | $ | 375,500 | $ | 509,012 | $ | 726,509 | |||||||||||
|
_____________________ |
|||
| (1) | Amount for the six months ended January 31, 2019 excludes approximately $0.3 million of deferred revenue assumed in the Frame acquisition. | ||
| (2) | Approximately $3.4 million of hardware was included in deferred revenue as of January 31, 2018. | ||
| (3) | Software and support revenue and billings include software and support, entitlements and other services revenue and billings. | ||
|
NUTANIX, INC. |
||||||||||||||||||||||||||||||||||||||||
|
Reconciliation of GAAP to Non-GAAP Profit Measures |
||||||||||||||||||||||||||||||||||||||||
|
(Unaudited) |
||||||||||||||||||||||||||||||||||||||||
| GAAP | Non-GAAP Adjustments | Non-GAAP | ||||||||||||||||||||||||||||||||||||||
|
Three Months Ended |
(1) | (2) | (3) | (4) | (5) | (6) |
Three Months Ended |
|||||||||||||||||||||||||||||||||
| (in thousands, except share and per share data) | ||||||||||||||||||||||||||||||||||||||||
| Gross profit | $ | 249,378 | $ | 4,245 | $ | 3,692 | $ | — | $ | 163 | $ | — | $ | — | $ | 257,478 | ||||||||||||||||||||||||
| Gross margin | 74.4 | % | 1.3 | % | 1.1 | % | — | — | — | — | 76.8 | % | ||||||||||||||||||||||||||||
| Operating expenses: | ||||||||||||||||||||||||||||||||||||||||
| Sales and marketing | 213,707 | (23,462 | ) | (666 | ) | — | — | — | — | 189,579 | ||||||||||||||||||||||||||||||
| Research and development | 123,037 | (34,679 | ) | — | — | — | — | — | 88,358 | |||||||||||||||||||||||||||||||
| General and administrative | 28,788 | (10,179 | ) | — | (40 | ) | (4 | ) | — | — | 18,565 | |||||||||||||||||||||||||||||
| Total operating expenses | 365,532 | (68,320 | ) | (666 | ) | (40 | ) | (4 | ) | — | — | 296,502 | ||||||||||||||||||||||||||||
| Loss from operations | (116,154 | ) | 72,565 | 4,358 | 40 | 167 | — | — | (39,024 | ) | ||||||||||||||||||||||||||||||
| Net loss | $ | (122,763 | ) | $ | 72,565 | $ | 4,358 | $ | 40 | $ | 167 | $ | 7,267 | $ | (2,044 | ) | $ | (40,410 | ) | |||||||||||||||||||||
| Weighted shares outstanding, basic and diluted | 179,444,648 | 179,444,648 | ||||||||||||||||||||||||||||||||||||||
| Net loss per share, basic and diluted | $ | (0.68 | ) | $ | 0.40 | $ | 0.02 | $ | — | $ | — | $ | 0.04 | $ | (0.01 | ) | $ | (0.23 | ) | |||||||||||||||||||||
|
_____________________ |
|||
| (1) | Stock-based compensation expense | ||
| (2) | Amortization of intangible assets | ||
| (3) | Acquisition-related costs | ||
| (4) | Other | ||
| (5) | Amortization of debt discount and issuance costs | ||
| (6) | Tax effect of a change in law | ||
| GAAP | Non-GAAP Adjustments | Non-GAAP | |||||||||||||||||||||||||||||||||||||||||||
|
Six Months Ended |
(1) | (2) | (3) | (4) |
(5) |
(6) | (7) |
Six Months Ended |
|||||||||||||||||||||||||||||||||||||
| (in thousands, except share and per share data) | |||||||||||||||||||||||||||||||||||||||||||||
| Gross profit | $ | 488,555 | $ | 8,100 | $ | 6,860 | $ | — | $ | — | $ | — | $ | 163 | $ | — | $ | 503,678 | |||||||||||||||||||||||||||
| Gross margin | 75.3 | % | 1.3 | % | 1.1 | % | — | — | — | — | — | 77.7 | % | ||||||||||||||||||||||||||||||||
| Operating expenses: | |||||||||||||||||||||||||||||||||||||||||||||
| Sales and marketing | 410,204 | (46,068 | ) | (1,216 | ) | — | — | — | — | — | 362,920 | ||||||||||||||||||||||||||||||||||
| Research and development | 233,568 | (65,688 | ) | — | — | — | — | — | 167,880 | ||||||||||||||||||||||||||||||||||||
| General and administrative | 56,127 | (18,634 | ) | (521 | ) | 795 | — | — | — | 37,767 | |||||||||||||||||||||||||||||||||||
| Total operating expenses | 699,899 | (130,390 | ) | (1,216 | ) | (521 | ) | 795 | — | — | — | 568,567 | |||||||||||||||||||||||||||||||||
| Loss from operations | (211,344 | ) | 138,490 | 8,076 | 521 | (795 | ) | — | 163 | — | (64,889 | ) | |||||||||||||||||||||||||||||||||
| Net loss | $ | (217,028 | ) | $ | 138,490 | $ | 8,076 | $ | 521 | $ | (795 | ) | $ | 14,415 | $ | 163 | $ | (7,904 | ) | $ | (64,062 | ) | |||||||||||||||||||||||
| Weighted shares outstanding, basic and diluted | 177,428,029 | 177,428,029 | |||||||||||||||||||||||||||||||||||||||||||
| Net loss per share, basic and diluted | $ | (1.22 | ) | $ | 0.78 | $ | 0.05 | $ | — | $ | — | $ | 0.08 | $ | — | $ | (0.05 | ) | $ | (0.36 | ) | ||||||||||||||||||||||||
|
_____________________ |
|||
| (1) | Stock-based compensation expense | ||
| (2) | Amortization of intangible assets | ||
| (3) | Acquisition-related costs | ||
| (4) | Change in fair value of contingent consideration assumed in the PernixData acquisition | ||
| (5) | Amortization of debt discount and issuance costs | ||
| (6) | Other | ||
| (7) | Partial release of valuation allowance from acquisition and tax effect of a change in law | ||
| GAAP | Non-GAAP Adjustments | Non-GAAP | ||||||||||||||||||||||||||||||||||||||
|
Three Months Ended |
(1) | (2) | (3) | (4) | (5) | (6) |
Three Months Ended |
|||||||||||||||||||||||||||||||||
| (in thousands, except share and per share data) | ||||||||||||||||||||||||||||||||||||||||
| Gross profit | $ | 178,216 | $ | 2,817 | $ | 1,164 | $ | — | $ | — | $ | — | $ | — | $ | 182,197 | ||||||||||||||||||||||||
| Gross margin | 62.2 | % | 0.9 | % | 0.4 | % | — | — | — | — | 63.5 | % | ||||||||||||||||||||||||||||
| Operating expenses: | ||||||||||||||||||||||||||||||||||||||||
| Sales and marketing | 151,201 | (15,942 | ) | (192 | ) | — | — | — | — | 135,067 | ||||||||||||||||||||||||||||||
| Research and development | 70,924 | (17,023 | ) | — | — | — | — | — | 53,901 | |||||||||||||||||||||||||||||||
| General and administrative | 15,948 | (6,229 | ) | — | 4,237 | — | (528 | ) | — | 13,428 | ||||||||||||||||||||||||||||||
| Total operating expenses | 238,073 | (39,194 | ) | (192 | ) | 4,237 | — | (528 | ) | — | 202,396 | |||||||||||||||||||||||||||||
| Loss from operations | (59,857 | ) | 42,011 | 1,356 | (4,237 | ) | — | 528 | — | (20,199 | ) | |||||||||||||||||||||||||||||
| Net loss | $ | (62,631 | ) | $ | 42,011 | $ | 1,356 | $ | (4,237 | ) | $ | 738 | $ | 528 | $ | (940 | ) | $ | (23,175 | ) | ||||||||||||||||||||
| Weighted shares outstanding, basic and diluted | 161,737,428 | 161,737,428 | ||||||||||||||||||||||||||||||||||||||
| Net loss per share, basic and diluted | $ | (0.39 | ) | $ | 0.26 | $ | 0.01 | $ | (0.03 | ) | $ | 0.01 | $ | 0.01 | $ | (0.01 | ) | $ | (0.14 | ) | ||||||||||||||||||||
|
_____________________ |
||
| (1) | Stock-based compensation expense | |
| (2) | Amortization of intangible assets | |
| (3) | Change in fair value of contingent consideration assumed in the PernixData acquisition | |
| (4) | Amortization of debt discount and debt issuance costs | |
| (5) | Acquisition-related costs | |
| (6) | Income tax effect primarily related to stock-based compensation expense | |
| GAAP | Non-GAAP Adjustments | Non-GAAP | ||||||||||||||||||||||||||||||||||||||
|
Six Months Ended |
(1) | (2) | (3) | (4) | (5) | (6) |
Six Months Ended |
|||||||||||||||||||||||||||||||||
| (in thousands, except share and per share data) | ||||||||||||||||||||||||||||||||||||||||
| Gross profit | $ | 345,146 | $ | 5,459 | $ | 2,059 | $ | — | $ | — | $ | — | $ | 352,664 | ||||||||||||||||||||||||||
| Gross margin | 61.4 | % | 1.0 | % | 0.3 | % | — | — | 62.7 | % | ||||||||||||||||||||||||||||||
| Operating expenses: | ||||||||||||||||||||||||||||||||||||||||
| Sales and marketing | 296,606 | (29,708 | ) | (403 | ) | — | — | — | — | 266,495 | ||||||||||||||||||||||||||||||
| Research and development | 135,436 | (32,565 | ) | — | — | — | — | — | 102,871 | |||||||||||||||||||||||||||||||
| General and administrative | 32,000 | (9,794 | ) | — | 3,955 | — | (528 | ) | — | 25,633 | ||||||||||||||||||||||||||||||
| Total operating expenses | 464,042 | (72,067 | ) | (403 | ) | 3,955 | — | (528 | ) | — | 394,999 | |||||||||||||||||||||||||||||
| Loss from operations | (118,896 | ) | 77,526 | 2,462 | (3,955 | ) | — | 528 | — | (42,335 | ) | |||||||||||||||||||||||||||||
| Net loss | $ | (124,118 | ) | $ | 77,526 | $ | 2,462 | $ | (3,955 | ) | $ | 738 | $ | 528 | $ | (1,072 | ) | $ | (47,891 | ) | ||||||||||||||||||||
| Weighted shares outstanding, basic and diluted | 159,251,964 | 159,251,964 | ||||||||||||||||||||||||||||||||||||||
| Net loss per share, basic and diluted | $ | (0.78 | ) | $ | 0.49 | $ | 0.02 | $ | (0.02 | ) | $ | — | $ | — | $ | (0.01 | ) | $ | (0.30 | ) | ||||||||||||||||||||
|
_____________________ |
|||
| (1) | Stock-based compensation expense | ||
| (2) | Amortization of intangible assets | ||
| (3) | Change in fair value of contingent consideration assumed in the PernixData acquisition | ||
| (4) | Amortization of debt discount and debt issuance costs | ||
| (5) | Acquisition-related costs | ||
| (6) | Income tax effect primarily related to stock-based compensation expense | ||
|
NUTANIX, INC. |
||||||||||||||||||||
|
Reconciliation of GAAP Net Cash Provided by Operating Activities to Non-GAAP Free Cash Flow |
||||||||||||||||||||
|
(Unaudited) |
||||||||||||||||||||
| Three Months Ended January 31, |
Six Months Ended January 31, |
|||||||||||||||||||
| 2018 | 2019 | 2018 | 2019 | |||||||||||||||||
| (in thousands) | ||||||||||||||||||||
| Net cash provided by operating activities | $ | 46,414 | $ | 38,490 | $ | 56,512 | $ | 88,314 | ||||||||||||
| Purchases of property and equipment | (14,028 | ) | (42,551 | ) | (31,993 | ) | (72,383 | ) | ||||||||||||
| Free cash flow | $ | 32,386 | $ | (4,061 | ) | $ | 24,519 | $ | 15,931 | |||||||||||
View source version on businesswire.com: https://www.businesswire.com/news/home/20190228005879/en/
Investor Contact:
Tonya Chin
408-560-2675
tonya@nutanix.com
Media Contact:
Kate Reed
973-534-9292
kreed@nutanix.com
Source: Nutanix, Inc.