Nutanix Reports Fourth Quarter and Fiscal 2018 Financial Results
--Drives 66 Percent YoY Growth in Q4 Software and Support Billings and 49 Percent YoY Increase in Q4 Software and Support Revenue
--Delivers 78 Percent Q4 Non-GAAP Gross Margin as Company Continues Successful Shift to Software-Defined Business
SAN JOSE, Calif.--(BUSINESS WIRE)-- Nutanix, Inc. (NASDAQ: NTNX), a leader in enterprise cloud computing, today announced financial results for its fourth quarter and fiscal year ended July 31, 2018.
This press release features multimedia. View the full release here: https://www.businesswire.com/news/home/20180830005715/en/
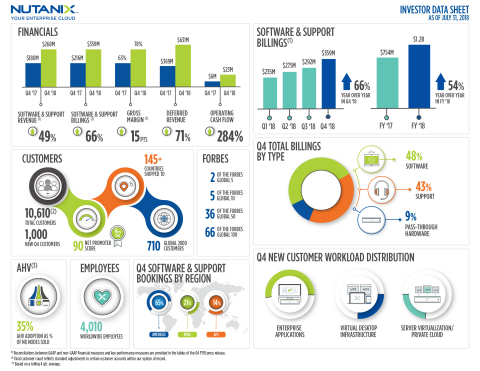
Nutanix Q4 and Fiscal 2018 Highlights (Graphic: Business Wire)
Fourth Quarter Fiscal 2018 Financial Highlights
- Revenue: $303.7 million (at 77.7% non-GAAP gross margin), up from $252.5 million (at 62.6% non-GAAP gross margin) in the fourth quarter of fiscal 2017, reflecting the elimination of approximately $95 million in pass-through hardware revenue in the quarter as the company continues to execute its shift toward increasing software revenue1
- Software and Support Revenue: $267.9 million, growing 49% year-over-year from $179.6 million in the fourth quarter of fiscal 2017
- Billings: $395.1 million, growing 37% year-over-year from $289.2 million in the fourth quarter of fiscal 2017
- Software and Support Billings: $359.2 million, growing 66% year-over-year from $216.3 million in the fourth quarter of fiscal 2017
- Gross Margin: GAAP gross margin of 75.9%, up from 61.4% in the fourth quarter of fiscal 2017; Non-GAAP gross margin of 77.7%, up from 62.6% in the fourth quarter of fiscal 2017
- Net Loss: GAAP net loss of $87.4 million, compared to a GAAP net loss of $66.1 million in the fourth quarter of fiscal 2017; Non-GAAP net loss of $19.0 million, compared to a non-GAAP net loss of $26.0 million in the fourth quarter of fiscal 2017
- Net Loss Per Share: GAAP net loss per share of $0.51, compared to a GAAP net loss per share of $0.43 in the fourth quarter of fiscal 2017; Non-GAAP net loss per share of $0.11, compared to a non-GAAP net loss per share of $0.17 in the fourth quarter of fiscal 2017
- Cash and Short-term Investments: $934.3 million, up 168% from the fourth quarter of fiscal 2017
- Deferred Revenue: $631.2 million, up 71% from the fourth quarter of fiscal 2017
- Operating Cash Flow: $22.7 million, compared to $5.9 million in the fourth quarter of fiscal 2017
- Free Cash Flow: $6.5 million, compared to negative free cash flow of $6.5 million in the fourth quarter of fiscal 2017
Fiscal Year 2018 Financial Highlights
- Revenue: $1.16 billion (at 68.1% non-GAAP gross margin), up from $845.9 million (at 63.1% non-GAAP gross margin) in fiscal 2017, reflecting the elimination of approximately $169 million in pass-through hardware revenue in fiscal 2018 as the company continues to execute its shift toward increasing software revenue1
- Software and Support Revenue: $898.1 million, growing 47% year-over-year from $609.6 million in fiscal 2017
- Billings: $1.42 billion, growing 43% year-over-year from $990.5 million in fiscal 2017
- Software and Support Billings: $1.16 billion, growing 54% year-over-year from $754.2 million in fiscal 2017
- Gross Margin: GAAP gross margin of 66.6%, up from 61.3% in fiscal 2017; Non-GAAP gross margin of 68.1%, up from 63.1% in fiscal 2017
- Net Loss: GAAP net loss of $297.2 million, compared to a GAAP net loss of $379.6 million in fiscal 2017; Non-GAAP net loss of $101.5 million, compared to a non-GAAP net loss of $120.7 million in fiscal 2017
- Net Loss Per Share: GAAP net loss per share of $1.81, compared to a GAAP net loss per share of $2.96 in fiscal 2017; Non-GAAP net loss per share of $0.62, compared to a pro forma non-GAAP net loss per share of $0.85 in fiscal 2017
- Operating Cash Flow: $92.6 million, compared to $13.8 million in fiscal 2017
- Free Cash Flow: $30.2 million, compared to negative free cash flow of $36.4 million in fiscal 2017
Reconciliations between GAAP and non-GAAP financial measures and key performance measures are provided in the tables of this press release.
“We ended the year on a high note with a record quarter on many fronts, positioning us extremely well for the future. We will continue to invest in talent and hybrid cloud technology while incubating strategic multi-cloud investments such as Netsil, Beam, and now Frame,” said Dheeraj Pandey, Chairman, Founder and CEO of Nutanix. “Frame increases our addressable market, brings another service to our growing platform, and adds employees with insurgent mindsets who will help us continue to challenge the status quo.”
“The company’s strong achievement of 78 percent non-GAAP gross margin, the best in our history, is the direct result of our successful execution toward a software-defined business model,” said Duston Williams, CFO of Nutanix. “We’re also tracking above our target performance we set using the ‘Rule of 40’ framework, demonstrating our ability to balance growth and cash flow.”
Recent Company Highlights
- Completed the Acquisition of Frame: Acquired Frame, a leader in cloud-based Windows desktop and application delivery, increasing the company’s addressable market. IDC estimates that the desktops-as-a-service (DaaS) software market is forecast to grow to $3 billion in 2021 at a compound annual growth rate of 32%.2 With the addition of Frame, Nutanix customers will be able to deliver desktops-as-a-service from multiple clouds, combining the consumer-grade simplicity and web-scale design of cloud applications with the functionality of traditional virtual desktop applications.
- Achieved Milestone of $1 Billion+ in Annual Revenue in Less Than a Decade from Inception: Grew fiscal 2018 revenue to $1.16 billion, excluding $169 million in pass-through hardware revenue eliminated, crossing the $1 billion milestone.
- Expanded Customer Base Hitting Milestone 10,000+ Customers and Signed Largest Deal in History: Nutanix ended the fourth quarter of fiscal 2018 with 10,6103 end-customers, adding 1,000 new end-customers in the quarter. Notably, the company passed an important milestone, adding its 10,000th customer during the quarter. The company also expanded an existing customer engagement by closing a deal greater than $20 million in the quarter, the largest in Nutanix history.
- Successfully Continued Transition to a Software-Defined Business Model: Grew software and support billings by 66 percent year-over-year in the fourth quarter. Pass-through hardware billings decreased to 9 percent of total billings in the quarter, down from 25 percent in the fourth quarter of fiscal 2017.
- Launched 12 Culture Principles Representative of Company Values: Codified the company’s corporate values with the articulation and launch of 12 culture principles. These principles serve as the foundation for how Nutanix employees work with each other, with partners, and with customers.
- Added Two New Executives in Key Functions: Prabha Krishna joined Nutanix as the SVP of People and Places, and is responsible for the HR and facilities teams worldwide. In addition, Ben Ravani joined as the SVP of Xi Reliability Engineering to oversee building and operating Xi Cloud Services as well as serve as the General Manager of the Nutanix Seattle site.
- Introduced New Velocity Program for Scaling Growth in the Mid-Market: The company launched its Velocity channel program in June, aimed at accelerating the selling processes, incentives, and marketing investments for strategic, mid-market focused channel partners. The program provides a frictionless experience for channel partners, giving them more leverage to grow their business.
- Expanded its Global Workforce: Nutanix has rapidly increased and evolved its operations in India over the past five years and recently ranked second on “India’s Great Mid-Size Workplaces 2018” list. Additionally, the company continues to increase its headcount in Bangalore, Belgrade and Berlin as it further disrupts traditional enterprise IT incumbents with an increasingly global workforce.
- Certified as the First Hyperconvergence-Based Solution for SAP HANA®: In August, the company received certification from SAP for its AHV hypervisor and Enterprise Cloud OS platform as the first Hyperconverged Infrastructure (HCI) solution to pass SAP's stringent criteria for running production SAP HANA® deployments. With this milestone achievement, customers combine the cost and operational benefits of modernized IT infrastructure with the scale and performance required for SAP HANA. For Nutanix, this presents a significant opportunity to broaden penetration in Global 2000 accounts.
Q1 Fiscal 2019 Financial Outlook
For the first quarter of fiscal 2019, Nutanix expects:
- Revenue between $295 and $310 million, implying software and support revenue growth of approximately 40-45% YoY;
- Billings between $370 and $390 million, implying software and support billings growth of 50-55% YoY;
- Bill-to-revenue ratio of approximately 1.26x;
- Non-GAAP gross margin between 78% and 79%;
- Non-GAAP operating expenses between $280 and $290 million;
- Non-GAAP loss per share between $0.26 and $0.28, using approximately 176 million weighted shares outstanding
First quarter guidance reflects a faster removal of pass-through hardware than originally anticipated, accelerating the reduction of zero margin billings and revenue with the benefit of improved gross margins. Additionally, the Q1 expected bill-to-revenue ratio of 1.26x is higher than street consensus of 1.21x, implying an approximate $12 million in deferred revenue that would have otherwise been in revenue and gross profit.
1The elimination of hardware revenue is based on the estimated cost of hardware in transactions where our customers purchase such hardware directly from our contract manufacturers.
2IDC Worldwide Desktop-as-a-Service Software Forecast, 2017-2021, Robert Young, June 2017, IDC
3Final customer count reflects standard adjustments to certain customer accounts within our system of record.
Supplementary materials to this earnings release, including the company’s fourth quarter fiscal 2018 investor presentation, can be found at https://ir.nutanix.com/company/financial.
All forward-looking non-GAAP financial measures contained in the section titled "Q1 Fiscal 2019 Financial Outlook" exclude stock-based compensation expense and amortization of intangible assets and may also exclude, as applicable, other special items. The company has not reconciled guidance for non-GAAP gross margin, non-GAAP operating expenses and non-GAAP loss per share to their most directly comparable GAAP measures because such items that impact these measures are not within its control and are subject to constant change. While the actual amounts of such items will have a significant impact on the company’s non-GAAP gross margin, non-GAAP operating expenses and non-GAAP loss per share, a reconciliation of the non-GAAP financial measure guidance to the corresponding GAAP measures is not available without unreasonable effort.
Webcast and Conference Call Information
Nutanix executives will discuss the company’s fourth quarter and fiscal 2018 financial results on a conference call at 4:30 p.m. Eastern Time/1:30 p.m. Pacific Time today. To listen to the call via telephone, dial 1-833-227-5841 in the United States or 1-647-689-4068 from outside the United States. The conference ID is 7794736. This call will be webcast live and available to all interested parties on our Investor Relations website at ir.nutanix.com. Shortly after the conclusion of the conference call, a replay of the audio webcast will be available on the Nutanix Investor Relations website. A telephonic replay will be available for one week following the conference call at 1-800-585-8367 or 1-416-621-4642, conference ID 7794736.
New Accounting Standard
The Company adopted ASC 606, the new standard related to revenue recognition effective August 1, 2017. Prior period information has been adjusted to reflect the adoption of this new standard.
Non-GAAP Financial Measures and Other Key Performance Measures
To supplement our condensed consolidated financial statements, which are prepared and presented in accordance with GAAP, we use the following non-GAAP financial and other key performance measures: billings, non-GAAP gross margin, non-GAAP operating expenses, non-GAAP net loss, pro forma non-GAAP net loss per share, free cash flow, software and support revenue, and software and support billings. In computing these non-GAAP financial measures and key performance measures, we exclude certain items such as stock-based compensation and the related income tax impact, costs associated with our acquisitions (such as amortization of acquired intangible assets, revaluation of contingent consideration, income tax-related impact, and other acquisition-related costs), loss on debt extinguishment, amortization of debt discount and issuance costs, changes in the fair value of our preferred stock warrant liability, other non-recurring transactions and the related tax impact and the revenue and billings associated with pass-through hardware. Billings is a performance measure which our management believes provides useful information to investors because it represents the amounts under binding purchase orders received by us during a given period that have been billed, and we calculate billings by adding the change in deferred revenue between the start and end of the period to total revenue recognized in the same period. Free cash flow is a performance measure that our management believes provides useful information to management and investors about the amount of cash generated by the business after necessary capital expenditures, and we define free cash flow as net cash (used in) provided by operating activities less purchases of property and equipment. Non-GAAP gross margin, non-GAAP operating expenses, non-GAAP net loss, and pro forma non-GAAP net loss per share are financial measures which our management believes provide useful information to investors because they provide meaningful supplemental information regarding our performance and liquidity by excluding certain expenses and expenditures such as stock-based compensation expense that may not be indicative of our ongoing core business operating results. Software and support revenue and software and support billings are performance measures that our management believes provide useful information to our management and investors as it allows us to better track the true growth of our software business by excluding the amounts attributable to the pass-through hardware that we use to deliver our solutions. We use these non-GAAP financial and key performance measures for financial and operational decision-making and as a means to evaluate period-to-period comparisons. However, these non-GAAP financial and key performance measures have limitations as analytical tools and you should not consider them in isolation or as substitutes for analysis of our results as reported under GAAP. Billings, non-GAAP gross margin, non-GAAP operating expenses, non-GAAP net loss, pro forma non-GAAP net loss per share, and free cash flow are not substitutes for total revenue, gross margin, operating expenses, net loss, net loss per share, or net cash (used in) provided by operating activities, respectively, and software and support revenue and software and support billings are not substitutes for total revenue. In addition, other companies, including companies in our industry, may calculate non-GAAP financial measures and key performance measures differently or may use other measures to evaluate their performance, all of which could reduce the usefulness of our non-GAAP financial measures and key performance measures as tools for comparison. We urge you to review the reconciliation of our non-GAAP financial measures and key performance measures to the most directly comparable GAAP financial measures included below in the tables captioned “Reconciliation of Revenue to Billings,” “Disaggregation of Revenue and Reconciliation of Software and Support Revenue to Software and Support Billings,” “Reconciliation of GAAP to Non-GAAP Profit Measures,” and “Reconciliation of GAAP Net Cash (Used In) Provided By Operating Activities to Non-GAAP Free Cash Flow,” and not to rely on any single financial measure to evaluate our business.
Forward-Looking Statements
This press release contains express and implied forward-looking statements, including, but not limited to, statements relating to the impact of recent acquisitions to our business, our products, our total addressable market, the integration of recently acquired products, services, intellectual property and technology, our continued investment in talent and technology, industry estimates regarding the size and growth of the DaaS software market, the impact of the Velocity channel program, our continued geographic expansion, including in Bangalore, Belgrade and Berlin, our performance under the “Rule of 40” framework, plans and timing for, and the impact of, our transition to a software-defined business model, and anticipated future financial results, including but not limited to our guidance on estimated revenues, billings, non-GAAP gross margin, non-GAAP operating expenses and non-GAAP net loss per share for future fiscal periods. These forward-looking statements are not historical facts and instead are based on our current expectations, estimates, opinions, and beliefs. Consequently, you should not rely on these forward-looking statements. The accuracy of such forward-looking statements depends upon future events and involves risks, uncertainties, and other factors beyond our control that may cause these statements to be inaccurate and cause our actual results, performance or achievements to differ materially and adversely from those anticipated or implied by such statements, including, among others: failure to develop, or unexpected difficulties or delays in developing, new products, services, product features or technology in a timely or cost-effective basis; delays in or lack of customer or market acceptance of our new products, services, product features or technology; our ability to successfully integrate acquired companies, employees and intellectual property; delays in the transition to focus primarily on software-only transactions; the rapid evolution of the markets in which we compete; our ability to sustain or manage future growth effectively; factors that could result in the significant fluctuation of our future quarterly operating results, including, among other things, anticipated changes to our revenue and product mix which will slow revenue growth during such transition and make forecasting future performance more difficult, unanticipated challenges in the integration of recently acquired companies, the timing and magnitude of orders, shipments and acceptance of our solutions in any given quarter, our ability to attract new and retain existing end-customers, changes in the pricing of certain components of our solutions, and fluctuations in demand and competitive pricing pressures for our solutions; the introduction, or acceleration of adoption of, competing solutions, including public cloud infrastructure; and other risks detailed in our quarterly report on Form 10-Q for the quarter ended April 30, 2018, filed with the SEC on June 12, 2018. Additional information will also be set forth in our Form 10-K that will be filed for the fiscal year ended July 31, 2018, which should be read in conjunction with these financial results. Our SEC filings are available on the Investor Relations section of the company’s website at ir.nutanix.com and on the SEC's website at www.sec.gov. These forward-looking statements speak only as of the date of this press release and, except as required by law, we assume no obligation to update forward-looking statements to reflect actual results or subsequent events or circumstances.
About Nutanix
Nutanix is a global leader in cloud software and hyperconverged infrastructure solutions, making infrastructure invisible so that IT can focus on the applications and services that power their business. Companies around the world use Nutanix Enterprise Cloud OS platform to bring one-click application management and mobility across public, private and distributed edge clouds so they can run any application at any scale with a dramatically lower total cost of ownership. The result is organizations that can rapidly deliver a high-performance IT environment on demand, giving application owners a true cloud-like experience. Learn more at www.nutanix.com or follow us on Twitter @nutanix.
© 2018 Nutanix, Inc. All rights reserved. Nutanix, the Nutanix logo, Frame, and all product and service names mentioned herein are registered trademarks or trademarks of Nutanix, Inc. in the United States and other countries. All other brand names mentioned herein are for identification purposes only and may be the trademarks of their respective holder(s).
| NUTANIX, INC. | ||||||||||
| CONSOLIDATED BALANCE SHEETS | ||||||||||
| (Unaudited) | ||||||||||
| As of | ||||||||||
| July 31, | July 31, | |||||||||
| 2017 | 2018 | |||||||||
| (in thousands) | ||||||||||
| Assets | ||||||||||
| Current assets: | ||||||||||
| Cash and cash equivalents | $ | 138,359 | $ | 305,975 | ||||||
| Short-term investments | 210,694 | 628,328 | ||||||||
| Accounts receivable, net | 178,876 | 258,289 | ||||||||
| Deferred commissions—current | 23,843 | 33,691 | ||||||||
| Prepaid expenses and other current assets | 28,362 | 36,818 | ||||||||
| Total current assets | 580,134 | 1,263,101 | ||||||||
| Property and equipment, net | 58,072 | 85,111 | ||||||||
| Deferred commissions—non-current | 49,684 | 80,688 | ||||||||
| Intangible assets, net | 26,001 | 45,366 | ||||||||
| Goodwill | 16,672 | 87,759 | ||||||||
| Other assets—non-current | 7,649 | 37,855 | ||||||||
| Total assets | $ | 738,212 | $ | 1,599,880 | ||||||
| Liabilities and Stockholders’ Equity | ||||||||||
| Current liabilities: | ||||||||||
| Accounts payable | $ | 73,725 | $ | 65,503 | ||||||
| Accrued compensation and benefits | 57,521 | 85,398 | ||||||||
| Accrued expenses and other current liabilities | 9,707 | 31,682 | ||||||||
| Deferred revenue—current | 170,123 | 275,648 | ||||||||
| Total current liabilities | 311,076 | 458,231 | ||||||||
| Deferred revenue—non-current | 198,933 | 355,559 | ||||||||
| Convertible senior notes, net | — | 429,598 | ||||||||
| Other liabilities—non-current | 11,140 | 29,713 | ||||||||
| Total liabilities | 521,149 | 1,273,101 | ||||||||
| Stockholders’ equity: | ||||||||||
| Common stock | 4 | 4 | ||||||||
| Additional paid-in capital | 948,134 | 1,355,907 | ||||||||
| Accumulated other comprehensive loss | (106 | ) | (1,002 | ) | ||||||
| Accumulated deficit | (730,969 | ) | (1,028,130 | ) | ||||||
| Total stockholders’ equity | 217,063 | 326,779 | ||||||||
| Total liabilities and stockholders’ equity | $ | 738,212 | $ | 1,599,880 | ||||||
| NUTANIX, INC. | ||||||||||||||||||||
| CONSOLIDATED STATEMENTS OF OPERATIONS | ||||||||||||||||||||
| (Unaudited) | ||||||||||||||||||||
| Three Months Ended | Fiscal Year Ended | |||||||||||||||||||
| July 31, | July 31, | |||||||||||||||||||
| 2017 | 2018 | 2017 | 2018 | |||||||||||||||||
| (in thousands, except share and per share data) | ||||||||||||||||||||
| Revenue: | ||||||||||||||||||||
| Product | $ | 201,472 | $ | 224,650 | $ | 673,297 | $ | 887,989 | ||||||||||||
| Support, entitlements and other services | 50,986 | 79,098 | 172,606 | 267,468 | ||||||||||||||||
| Total revenue | 252,458 | 303,748 | 845,903 | 1,155,457 | ||||||||||||||||
| Cost of revenue: | ||||||||||||||||||||
| Product (1)(2) | 76,187 | 41,068 | 249,393 | 276,127 | ||||||||||||||||
| Support, entitlements and other services (1) | 21,330 | 32,197 | 77,938 | 109,903 | ||||||||||||||||
| Total cost of revenue | 97,517 | 73,265 | 327,331 | 386,030 | ||||||||||||||||
| Gross profit | 154,941 | 230,483 | 518,572 | 769,427 | ||||||||||||||||
| Operating expenses: | ||||||||||||||||||||
| Sales and marketing (1)(2) | 134,276 | 183,191 | 501,021 | 649,657 | ||||||||||||||||
| Research and development (1) | 67,817 | 97,050 | 288,619 | 313,777 | ||||||||||||||||
| General and administrative (1) | 16,878 | 29,472 | 77,341 | 86,401 | ||||||||||||||||
| Total operating expenses | 218,971 | 309,713 | 866,981 | 1,049,835 | ||||||||||||||||
| Loss from operations | (64,030 | ) | (79,230 | ) | (348,409 | ) | (280,408 | ) | ||||||||||||
| Other expense, net | (547 | ) | (4,021 | ) | (26,377 | ) | (9,306 | ) | ||||||||||||
| Loss before provision for income taxes | (64,577 | ) | (83,251 | ) | (374,786 | ) | (289,714 | ) | ||||||||||||
| Provision for income taxes | 1,555 | 4,118 | 4,852 | 7,447 | ||||||||||||||||
| Net loss | $ | (66,132 | ) | $ | (87,369 | ) | $ | (379,638 | ) | $ | (297,161 | ) | ||||||||
| Net loss per share attributable to Class A and Class B common stockholders—basic and diluted | $ | (0.43 | ) | $ | (0.51 | ) | $ | (2.96 | ) | $ | (1.81 | ) | ||||||||
| Weighted average shares used in computing net loss per share attributable to Class A and Class B common stockholders—basic and diluted | 152,581,557 | 171,197,547 | 128,295,563 | 164,091,302 | ||||||||||||||||
(1) Includes the following stock-based compensation expense:
| Three Months Ended | Fiscal Year Ended | ||||||||||||||||||
| July 31, | July 31, | ||||||||||||||||||
| 2017 | 2018 | 2017 | 2018 | ||||||||||||||||
| (in thousands) | |||||||||||||||||||
| Product cost of sales | $ | 642 | $ | 692 | $ | 3,066 | $ | 2,580 | |||||||||||
| Support, entitlements and other services cost of sales | 2,201 | 2,789 | 10,411 | 8,945 | |||||||||||||||
| Sales and marketing | 12,972 | 17,301 | 78,117 | 65,060 | |||||||||||||||
| Research and development | 19,218 | 25,350 | 109,044 | 74,389 | |||||||||||||||
| General and administrative | 2,772 | 9,264 | 30,853 | 26,894 | |||||||||||||||
| Total stock-based compensation expense | $ | 37,805 | $ | 55,396 | $ | 231,491 | $ | 177,868 | |||||||||||
(2) Includes the following amortization of intangible assets:
| Three Months Ended | Fiscal Year Ended | ||||||||||||||||
| July 31, | July 31, | ||||||||||||||||
| 2017 | 2018 | 2017 | 2018 | ||||||||||||||
| (in thousands) | |||||||||||||||||
| Product cost of sales | $ | 358 | $ | 2,135 | $ | 1,314 | $ | 5,641 | |||||||||
| Sales and marketing | 250 | 289 | 915 | 914 | |||||||||||||
| Total amortization of intangible assets | $ | 608 | $ | 2,424 | $ | 2,229 | $ | 6,555 | |||||||||
|
NUTANIX, INC. |
||||||||||
|
CONSOLIDATED STATEMENTS OF CASH FLOWS |
||||||||||
|
(Unaudited) |
||||||||||
| Fiscal Year Ended | ||||||||||
| July 31, | ||||||||||
| 2017 | 2018 | |||||||||
| (in thousands) | ||||||||||
| Cash flows from operating activities: | ||||||||||
| Net loss | $ | (379,638 | ) | $ | (297,161 | ) | ||||
| Adjustments to reconcile net loss to net cash provided by operating activities: | ||||||||||
| Depreciation and amortization | 38,399 | 50,302 | ||||||||
| Stock-based compensation | 231,491 | 177,868 | ||||||||
| Amortization of debt discount and debt issuance cost | — | 14,685 | ||||||||
| Change in fair value of contingent consideration | 1,924 | (2,423 | ) | |||||||
| Loss on debt extinguishment | 3,320 | — | ||||||||
| Change in fair value of convertible preferred stock warrant liability | 21,133 | — | ||||||||
| Other | 764 | (962 | ) | |||||||
| Changes in operating assets and liabilities: | ||||||||||
| Accounts receivable, net | (67,382 | ) | (79,273 | ) | ||||||
| Deferred commissions | (24,006 | ) | (40,852 | ) | ||||||
| Prepaid expenses and other assets | (15,830 | ) |
(37,359 |
) | ||||||
| Accounts payable | 21,280 | (16,469 | ) | |||||||
| Accrued compensation and benefits | 32,687 | 27,877 | ||||||||
| Accrued expenses and other liabilities | 5,116 | 34,295 | ||||||||
| Deferred revenue | 144,564 | 262,027 | ||||||||
| Net cash provided by operating activities | 13,822 |
92,555 |
||||||||
| Cash flows from investing activities: | ||||||||||
| Purchases of investments | (242,525 | ) | (716,417 | ) | ||||||
| Maturities of investments | 84,156 | 297,461 | ||||||||
| Sales of investments | 32,640 | — | ||||||||
| Purchases of property and equipment | (50,181 | ) | (62,372 | ) | ||||||
| Payments for business combinations, net of cash acquired | (184 | ) |
(22,227 |
) | ||||||
| Net cash used in investing activities | (176,094 | ) |
(503,555 |
) | ||||||
| Cash flows from financing activities: | ||||||||||
| Proceeds from issuance of convertible senior notes, net | — | 563,587 | ||||||||
| Proceeds from issuance of warrants | — | 87,975 | ||||||||
| Payments for the cost of convertible note hedges | — | (143,175 | ) | |||||||
| Proceeds from sales of shares through employee equity incentive plans, net of repurchases | 32,254 | 72,010 | ||||||||
| Payment of debt in conjunction with business combinations | (7,124 | ) | (1,696 | ) | ||||||
| Proceeds from initial public offering, net of underwriting discounts and commissions | 254,455 | — | ||||||||
| Repayment of senior notes | (75,000 | ) | — | |||||||
| Debt extinguishment costs | (1,580 | ) | — | |||||||
| Payments of offering costs | (1,717 | ) | (85 | ) | ||||||
| Other | 134 | — | ||||||||
| Net cash provided by financing activities | 201,422 | 578,616 | ||||||||
| Net increase in cash and cash equivalents | 39,150 | 167,616 | ||||||||
| Cash and cash equivalents—beginning of period | 99,209 | 138,359 | ||||||||
| Cash and cash equivalents—end of period | $ | 138,359 | $ | 305,975 | ||||||
|
Supplemental disclosures of cash flow information: |
||||||||||
|
Cash paid for income taxes |
$ | 5,213 | $ | 10,116 | ||||||
| Cash paid for interest | $ | 1,271 | $ | — | ||||||
| Supplemental disclosures of non-cash investing and financing information: | ||||||||||
| Issuance of common stock for business combinations | $ | 27,063 | $ | 63,780 | ||||||
| Purchases of property and equipment included in accounts payable and accrued liabilities | $ | 5,591 | $ | 13,444 | ||||||
| Vesting of early exercised stock options | $ | 1,614 | $ | 681 | ||||||
| Offering costs included in accounts payable | $ | 85 | $ | — | ||||||
| Conversion of convertible preferred stock to common stock, net of issuance costs | $ | 310,379 | $ | — | ||||||
| Reclassification of convertible preferred stock warrant liability to additional paid-in capital | $ | 30,812 | $ | — | ||||||
| Reconciliation of Revenue to Billings | |||||||||||||||||||
| (Unaudited) | |||||||||||||||||||
| Three Months Ended | Fiscal Year Ended | ||||||||||||||||||
| July 31, | July 31, | ||||||||||||||||||
| 2017 | 2018 | 2017 | 2018 | ||||||||||||||||
| (in thousands) | |||||||||||||||||||
| Total revenue | $ | 252,458 | $ | 303,748 | $ | 845,903 | $ | 1,155,457 | |||||||||||
| Change in deferred revenue, net of acquisitions (1) | 36,715 | 91,318 | 144,564 | 262,027 | |||||||||||||||
| Billings | $ | 289,173 | $ | 395,066 | $ | 990,467 | $ | 1,417,484 | |||||||||||
|
_____________________ |
|||
| (1) | Amount for the fiscal year ended July 31, 2017 excludes approximately $6.0 million of deferred revenue assumed in the PernixData acquisition. Amount for the twelve months ended July 31, 2018 excludes approximately $0.1 million of deferred revenue assumed in an acquisition. | ||
| Disaggregation of Revenue and Reconciliation of Software and Support Revenue to Software and Support Billings | ||||||||||||||||
| (Unaudited) | ||||||||||||||||
| Three Months Ended | Fiscal Year Ended | |||||||||||||||
| July 31, | July 31, | |||||||||||||||
| 2017 | 2018 | 2017 | 2018 | |||||||||||||
| (in thousands) | ||||||||||||||||
| Software revenue | $ | 128,581 | $ | 188,790 | $ | 436,981 | $ | 630,675 | ||||||||
| Hardware revenue | 72,891 | 35,860 | 236,316 | 257,314 | ||||||||||||
| Product revenue | 201,472 | 224,650 | 673,297 | 887,989 | ||||||||||||
| Support, entitlements and other services revenue | 50,986 | 79,098 | 172,606 | 267,468 | ||||||||||||
| Total revenue | $ | 252,458 | $ | 303,748 | $ | 845,903 | $ | 1,155,457 | ||||||||
| Total software and support revenue | $ | 179,567 | $ | 267,888 | $ | 609,587 | $ | 898,143 | ||||||||
| Change in software and support deferred revenue, net of acquisitions (1) | 36,715 | 91,318 | 144,564 | 262,027 | ||||||||||||
| Software and support billings | $ | 216,282 | $ | 359,206 | $ | 754,151 | $ | 1,160,170 | ||||||||
|
_____________________ |
|||
| (1) | Amount for the fiscal year ended July 31, 2017 excludes approximately $6.0 million of deferred revenue assumed in the PernixData acquisition. Amount for the twelve months ended July 31, 2018 excludes approximately $0.1 million of deferred revenue assumed in an acquisition. | ||
| Reconciliation of GAAP to Non-GAAP Profit Measures | ||||||||||||||||||||||||||||||||||||||||
| (Unaudited) | ||||||||||||||||||||||||||||||||||||||||
| GAAP | Non-GAAP Adjustments | Non-GAAP | ||||||||||||||||||||||||||||||||||||||
| Three Months | Three Months | |||||||||||||||||||||||||||||||||||||||
|
Ended July 31, |
Ended July 31, |
|||||||||||||||||||||||||||||||||||||||
|
2018 |
(1) | (2) | (3) | (4) | (5) | (6) |
2018 |
|||||||||||||||||||||||||||||||||
| (in thousands, except share and per share data) | ||||||||||||||||||||||||||||||||||||||||
| Gross profit | $ | 230,483 | $ | 3,481 | $ | 2,135 | $ | — | $ | — | $ | — | $ | — | $ | 236,099 | ||||||||||||||||||||||||
| Gross margin | 75.9 | % | 1.1 | % | 0.7 | % | — | — | — | — | 77.7 | % | ||||||||||||||||||||||||||||
| Operating expenses: | ||||||||||||||||||||||||||||||||||||||||
| Sales and marketing | 183,191 | (17,301 | ) | (289 | ) | — | — | — | — | 165,601 | ||||||||||||||||||||||||||||||
| Research and development | 97,050 | (25,350 | ) | — | — | — | — | — | 71,700 | |||||||||||||||||||||||||||||||
| General and administrative | 29,472 | (9,264 | ) | — | (948 | ) | (714 | ) | — | — | 18,546 | |||||||||||||||||||||||||||||
| Total operating expenses | 309,713 | (51,915 | ) | (289 | ) | (948 | ) | (714 | ) | — | — | 255,847 | ||||||||||||||||||||||||||||
| Loss from operations | (79,230 | ) | 55,396 | 2,424 | 948 | 714 | — | — | (19,748 | ) | ||||||||||||||||||||||||||||||
| Net loss | $ | (87,369 | ) | $ | 55,396 | $ | 2,424 | $ | 948 | $ | 714 | $ | 7,031 | $ | 1,834 | $ | (19,022 | ) | ||||||||||||||||||||||
| Weighted shares outstanding, basic and diluted | 171,197,547 | 171,197,547 | ||||||||||||||||||||||||||||||||||||||
| Net loss per share, basic and diluted | $ | (0.51 | ) | $ | 0.32 | $ | 0.02 | $ | 0.01 | $ | — | $ | 0.04 | $ | 0.01 | $ | (0.11 | ) | ||||||||||||||||||||||
|
_____________________ |
|||
| (1) | Stock-based compensation expense | ||
| (2) | Amortization of intangible assets | ||
| (3) | Change in fair value of contingent consideration assumed in the PernixData acquisition | ||
| (4) | Acquisition-related costs | ||
| (5) | Amortization of debt discount and issuance costs | ||
| (6) | Income tax effect primarily related to stock-based compensation and migration of certain intangible assets. | ||
| GAAP | Non-GAAP Adjustments | Non-GAAP | ||||||||||||||||||||||||||||
| Three Months | Three Months | |||||||||||||||||||||||||||||
|
Ended July 31, |
Ended July 31, |
|||||||||||||||||||||||||||||
|
2017 |
(1) | (2) | (3) | (4) |
2017 |
|||||||||||||||||||||||||
| (in thousands, except share and per share data) | ||||||||||||||||||||||||||||||
| Gross profit | $ | 154,941 | $ | 2,843 | $ | 358 | $ | — | $ | — | $ | 158,142 | ||||||||||||||||||
| Gross margin | 61.4 | % | 1.1 | % | 0.1 | % | — | — | 62.6 | % | ||||||||||||||||||||
| Operating expenses: | ||||||||||||||||||||||||||||||
| Sales and marketing | 134,276 | (12,972 | ) | (250 | ) | — | — | 121,054 | ||||||||||||||||||||||
| Research and development | 67,817 | (19,218 | ) | — | — | — | 48,599 | |||||||||||||||||||||||
| General and administrative | 16,878 | (2,772 | ) | — | (1,748 | ) | — | 12,358 | ||||||||||||||||||||||
| Total operating expenses | 218,971 | (34,962 | ) | (250 | ) | (1,748 | ) | — | 182,011 | |||||||||||||||||||||
| Loss from operations | (64,030 | ) | 37,805 | 608 | 1,748 | — | (23,869 | ) | ||||||||||||||||||||||
| Net loss | $ | (66,132 | ) | $ | 37,805 | $ | 608 | $ | 1,748 | $ | (78 | ) | $ | (26,049 | ) | |||||||||||||||
| Weighted shares outstanding, basic and diluted | 152,581,557 | 152,581,557 | ||||||||||||||||||||||||||||
| Net loss per share, basic and diluted | $ | (0.43 | ) | $ | 0.25 | $ | — | $ | 0.01 | $ | — | $ | (0.17 | ) | ||||||||||||||||
|
_____________________ |
|||
| (1) | Stock-based compensation expense | ||
| (2) | Amortization of intangible assets | ||
| (3) | Change in fair value of contingent consideration assumed in the PernixData acquisition | ||
| (4) | Income tax effect primarily related to stock-based compensation expense | ||
| GAAP | Non-GAAP Adjustments | Non-GAAP | ||||||||||||||||||||||||||||||||||||||
| Fiscal Year | Fiscal Year | |||||||||||||||||||||||||||||||||||||||
|
Ended July 31, |
Ended July 31, |
|||||||||||||||||||||||||||||||||||||||
|
2018 |
(1) | (2) | (3) | (4) | (5) | (6) |
2018 |
|||||||||||||||||||||||||||||||||
| (in thousands, except share and per share data) | ||||||||||||||||||||||||||||||||||||||||
| Gross profit | $ | 769,427 | $ | 11,525 | $ | 5,641 | $ | — | $ | — | $ | — | $ | — | $ | 786,593 | ||||||||||||||||||||||||
| Gross margin | 66.6 | % | 1.0 | % | 0.5 | % | — | — | — | — | 68.1 | % | ||||||||||||||||||||||||||||
| Operating expenses: | ||||||||||||||||||||||||||||||||||||||||
| Sales and marketing | 649,657 | (65,060 | ) | (914 | ) | — | — | — | — | 583,683 | ||||||||||||||||||||||||||||||
| Research and development | 313,777 | (74,389 | ) | — | — | — | — | — | 239,388 | |||||||||||||||||||||||||||||||
| General and administrative | 86,401 | (26,894 | ) | — | 2,423 | (1,757 | ) | — | — | 60,173 | ||||||||||||||||||||||||||||||
| Total operating expenses | 1,049,835 | (166,343 | ) | (914 | ) | 2,423 | (1,757 | ) | — | — | 883,244 | |||||||||||||||||||||||||||||
| Loss from operations | (280,408 | ) | 177,868 | 6,555 | (2,423 | ) | 1,757 | — | — | (96,651 | ) | |||||||||||||||||||||||||||||
| Net loss | $ | (297,161 | ) | $ | 177,868 | $ | 6,555 | $ | (2,423 | ) | $ | 1,757 | $ | 14,685 | $ | (2,819 | ) | $ | (101,538 | ) | ||||||||||||||||||||
| Weighted shares outstanding, basic and diluted | 164,091,302 | 164,091,302 | ||||||||||||||||||||||||||||||||||||||
| Net loss per share, basic and diluted | $ | (1.81 | ) | $ | 1.08 | $ | 0.04 | $ | (0.01 | ) | $ | 0.01 | $ | 0.09 | $ | (0.02 | ) | $ | (0.62 | ) | ||||||||||||||||||||
|
_____________________ |
|||
| (1) | Stock-based compensation expense | ||
| (2) | Amortization of intangible assets | ||
| (3) | Change in fair value of contingent consideration assumed in the PernixData acquisition | ||
| (4) | Acquisition-related costs | ||
| (5) | Amortization of debt discount and issuance costs | ||
|
(6) |
Income tax effect primarily related to release of valuation allowance due to acquisitions, stock-based compensation and migration of certain intangible assets. | ||
| GAAP | Non-GAAP Adjustments | Non-GAAP | |||||||||||||||||||||||||||||||||||||||||||
| Fiscal Year | Fiscal Year | ||||||||||||||||||||||||||||||||||||||||||||
|
Ended July 31, |
Ended July 31, |
||||||||||||||||||||||||||||||||||||||||||||
|
2017 |
(1) | (2) | (3) | (4) | (5) | (6) | (7) |
2017 |
|||||||||||||||||||||||||||||||||||||
| (in thousands, except share and per share data) | |||||||||||||||||||||||||||||||||||||||||||||
| Gross profit | $ | 518,572 | $ | 13,477 | $ | 1,314 | $ | — | $ | — | $ | — | $ | — | $ | — | $ | 533,363 | |||||||||||||||||||||||||||
| Gross margin | 61.3 | % | 1.6 | % | 0.2 | % | — | — | — | — | — | 63.1 | % | ||||||||||||||||||||||||||||||||
| Operating expenses: | |||||||||||||||||||||||||||||||||||||||||||||
| Sales and marketing | 501,021 | (78,117 | ) | (915 | ) | — | — | — | — | — | 421,989 | ||||||||||||||||||||||||||||||||||
| Research and development | 288,619 | (109,044 | ) | — | — | — | — | — | — | 179,575 | |||||||||||||||||||||||||||||||||||
| General and administrative | 77,341 | (30,853 | ) | — | (672 | ) | (1,924 | ) | — | — | — | 43,892 | |||||||||||||||||||||||||||||||||
| Total operating expenses | 866,981 | (218,014 | ) | (915 | ) | (672 | ) | (1,924 | ) | — | — | — | 645,456 | ||||||||||||||||||||||||||||||||
| Loss from operations | (348,409 | ) | 231,491 | 2,229 | 672 | 1,924 | — | — | — | (112,093 | ) | ||||||||||||||||||||||||||||||||||
| Net loss | $ | (379,638 | ) | $ | 231,491 | $ | 2,229 | $ | 672 | $ | 1,924 | $ | 21,133 | $ | 3,320 | $ | (1,846 | ) | $ | (120,715 | ) | ||||||||||||||||||||||||
| Weighted shares outstanding, basic and diluted | 128,295,563 | 128,295,563 | |||||||||||||||||||||||||||||||||||||||||||
| Pro forma adjustment | 13,418,815 | 13,418,815 | |||||||||||||||||||||||||||||||||||||||||||
| Pro forma weighted shares outstanding, basic and diluted | 141,714,378 | 141,714,378 | |||||||||||||||||||||||||||||||||||||||||||
| Net loss per share, basic and diluted | $ | (2.96 | ) | ||||||||||||||||||||||||||||||||||||||||||
| Pro forma net loss per share, basic and diluted (8) | $ | (2.68 | ) | $ | 1.63 | $ | 0.02 | $ | 0.01 | $ | 0.01 | $ | 0.15 | $ | 0.02 | $ | (0.01 | ) | $ | (0.85 | ) | ||||||||||||||||||||||||
|
_____________________ |
|||
| (1) | Stock-based compensation expense | ||
| (2) | Amortization of intangible assets | ||
| (3) | Acquisition-related costs | ||
| (4) | Change in fair value of contingent consideration assumed in the PernixData acquisition | ||
| (5) | Change in fair value of preferred stock warrant liability | ||
| (6) | Loss on debt extinguishment | ||
| (7) | Income tax effect primarily related to release of valuation allowance due to acquisitions and stock-based compensation | ||
| (8) | Pro forma non-GAAP basic and diluted net loss per share was computed to give effect to the conversion of all outstanding convertible preferred stock upon closing of our initial public offering on October 5, 2016, as if the conversion had occurred at the beginning of the period. | ||
| Reconciliation of GAAP Net Cash Provided by Operating Activities to Non-GAAP Free Cash Flow | ||||||||||||||||||||
| (Unaudited) | ||||||||||||||||||||
| Three Months Ended | Fiscal Year Ended | |||||||||||||||||||
| July 31, | July 31, | |||||||||||||||||||
| 2017 | 2018 | 2017 | 2018 | |||||||||||||||||
| (in thousands) | ||||||||||||||||||||
| Net cash provided by operating activities | $ | 5,919 | $ |
22,745 |
$ | 13,822 | $ |
92,555 |
||||||||||||
| Purchases of property and equipment | (12,384 | ) | (16,283 | ) | (50,181 | ) | (62,372 | ) | ||||||||||||
| Free cash flow | $ | (6,465 | ) | $ |
6,462 |
$ | (36,359 | ) | $ |
30,183 |
||||||||||
View source version on businesswire.com: https://www.businesswire.com/news/home/20180830005715/en/
Nutanix, Inc.
Investor Contact:
Tonya Chin, 408-560-2675
tonya@nutanix.com
or
Media Contact:
Kate Reed, 973-534-9292
kreed@nutanix.com
Source: Nutanix, Inc.