Nutanix Reports Fourth Quarter and Fiscal 2017 Financial Results
72% Annual Revenue Growth, Record Large Deals in Q4, and 75% YoY Growth of Nutanix AHV Hypervisor Mark Strong Close to Fiscal 2017
This Smart News Release features multimedia. View the full release here: http://www.businesswire.com/news/home/20170831006099/en/
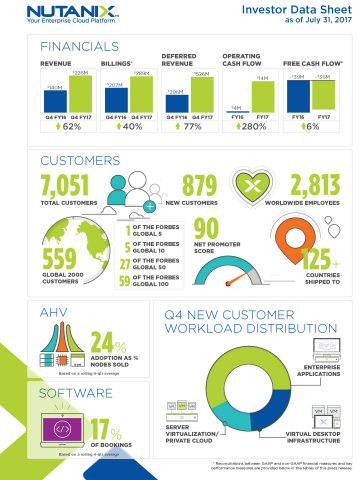
Nutanix Fiscal Q4'17 Earnings Infographic (Graphic: Business Wire)
Fourth Quarter Fiscal Year 2017 Financial Highlights
- Revenue:
$226.1 million , growing 62% year-over-year from$139.8 million in the fourth quarter of fiscal 2016 - Billings:
$289.2 million , growing 40% year-over-year from$206.6 million in the fourth quarter of fiscal 2016 - Net Loss: GAAP net loss of
$90.7 million , compared to a GAAP net loss of$49.9 million in the fourth quarter of fiscal 2016; Non-GAAP net loss of$50.6 million , compared to a non-GAAP net loss of$46.7 million in the fourth quarter of fiscal 2016 - Net Loss Per Share: GAAP net loss per share of
$0.59 , compared to a pro forma GAAP net loss per share of$0.41 in the fourth quarter of fiscal 2016; Non-GAAP net loss per share of$0.33 , compared to a pro forma non-GAAP net loss per share of$0.39 in the fourth quarter of fiscal 2016 - Cash and Short-term Investments:
$349.1 million , up 88% from the fourth quarter of fiscal 2016 - Deferred Revenue:
$526.1 million , up 77% from the fourth quarter of fiscal 2016 - Operating Cash Flow:
$5.9 million , compared to$2.4 million in the fourth quarter of fiscal 2016 - Free Cash Flow:
$(6.5) million , compared to$(6.5) million in the fourth quarter of fiscal 2016
Fiscal 2017 Financial Highlights
- Revenue:
$766.9 million , growing 72% year-over-year from$444.9 million in fiscal 2016 - Billings:
$990.5 million , growing 55% year-over-year from$637.8 million in fiscal 2016 - Net Loss: GAAP net loss of
$458.0 million , compared to a GAAP net loss of$168.5 million in fiscal 2016; Non-GAAP net loss of$199.1 million , compared to a non-GAAP net loss of$150.4 million in fiscal 2016 - Net Loss Per Share: GAAP net loss per share of
$3.57 , compared to a GAAP net loss per share of$3.83 in fiscal 2016; pro forma GAAP net loss per share of$3.23 , compared to a pro forma GAAP net loss per share of$1.40 in fiscal 2016; pro forma Non-GAAP net loss per share of$1.40 , compared to a pro forma non-GAAP net loss per share of$1.25 in fiscal 2016 - Operating Cash Flow:
$13.8 million , compared to$3.6 million in fiscal 2016 - Free Cash Flow:
$(36.4) million , compared to$(38.7) million in fiscal 2016
Reconciliations between GAAP and non-GAAP financial measures and key performance measures are provided in the tables of this press release.
“The fourth quarter was another record quarter and an outstanding conclusion to the fiscal year. Our newly announced products,
Recent Company Highlights
- Continued Customer Growth:
Nutanix ended the fourth quarter of fiscal 2017 with 7,051 end-customers, adding over 875 new end-customers during the quarter. Fourth quarter customer wins included ABC Stores,Amgen ,Bacardi ,HCA Healthcare ,Konica Minolta Business Solutions Europe GmbH , TheHershey Company , TheHome Depot , and Tokopedia. - Increased Number of $1 Million+ Deals: 43 customers with deals over
$1 million in the quarter, up 39% YoY. - Innovating for the Multi-Cloud Era: Introduced Nutanix Calm and Xi Cloud Services, along with a strategic alliance with
Google to blend theNutanix environment with the Google Cloud Platform, providing new functionality to address the challenges of the multi-cloud era. - Increased AHV Penetration: Saw a 75% YoY increase in adoption of AHV, Nutanix’s built-in hypervisor, based on a four-quarter rolling average of nodes using AHV as a percentage of total nodes sold.
- Strong Participation in 3rd Annual .
NEXT Conference : 3,500+ attendees with 50+ customer speakers, over 60 partner sponsors, and keynote addresses from many industry visionaries includingBill McDermott , CEO, SAP;Diane Greene , SVP, Google Cloud;Chad Sakac , President, VCE - Converged Platform Division, Dell EMC; andKirk Skaugen , EVP and President,Lenovo Datacenter Group .
Q1 Fiscal 2018 Financial Outlook
For the first quarter of fiscal 2018,
- Revenues between
$240 and $250 million ; - Non-GAAP gross margin of approximately 58%;
- Non-GAAP operating expenses between
$195 and $200 million ; - Non-GAAP net loss per share of
$0.37 , using 156 million weighted shares outstanding.
Supplementary materials to this earnings release, including the company’s fourth quarter fiscal 2017 investor presentation, can be found at http://ir.nutanix.com/company/financial/.
All forward-looking non-GAAP financial measures contained in this section titled "Q1 Fiscal 2018 Financial Outlook" exclude stock-based compensation expense, and may also exclude, as applicable, other special items. The company has not reconciled guidance for non-GAAP gross margin, non-GAAP operating expenses, and non-GAAP loss per share to their most directly comparable GAAP measures because such items that impact these measures are not within its control and are subject to constant change. While the actual amounts of such items will have a significant impact on the company’s non-GAAP gross margin, non-GAAP operating expenses, and non-GAAP loss per share, a reconciliation of the non-GAAP financial measure guidance to the corresponding GAAP measures is not available without unreasonable effort.
Webcast and Conference Call Information
New Revenue Standard—ASC 606
In
Non-GAAP Financial Measures and Other Key Performance Measures
To supplement our condensed consolidated financial statements, which are prepared and presented in accordance with GAAP, we use the following non-GAAP financial and other key performance measures: billings, non-GAAP gross margin percentage, non-GAAP operating expenses, non-GAAP net loss, pro forma non-GAAP net loss per share, and free cash flow. In computing these non-GAAP financial measures, we exclude certain items such as stock-based compensation and the related income tax impact, costs associated with our acquisitions (such as amortization of acquired intangible assets, revaluation of contingent consideration, income tax related impact, and other acquisition-related costs), loss on debt extinguishment, and changes in the fair value of our preferred stock warrant liability. Billings is a performance measure which our management believes provides useful information to investors because it represents the amounts under binding purchase orders received by us during a given period that have been billed, and we calculate billings by adding the change in deferred revenue between the start and end of the period to total revenue recognized in the same period. Free cash flow is a performance measure that our management believes provides useful information to management and investors about the amount of cash generated by the business after necessary capital expenditures, and we define free cash flow as net cash (used in) provided by operating activities less purchases of property and equipment. We use these non-GAAP financial and key performance measures for financial and operational decision-making and as a means to evaluate period-to-period comparisons. Our management believes that these non-GAAP financial and key performance measures provide meaningful supplemental information regarding our performance and liquidity by excluding certain expenses and expenditures such as stock-based compensation expense that may not be indicative of our ongoing core business operating results. However, these non-GAAP financial and key performance measures have limitations as analytical tools, and you should not consider them in isolation or as substitutes for analysis of our results as reported under GAAP. Billings, non-GAAP gross margin percentage, non-GAAP operating expenses, non-GAAP net loss, pro forma non-GAAP net loss per share, and free cash flow are not substitutes for total revenue, gross profit, operating expenses, net loss, net loss per share, or net cash (used in) provided by operating activities, respectively. In addition, other companies, including companies in our industry, may calculate non-GAAP financial measures and key performance measures differently or may use other measures to evaluate their performance, all of which could reduce the usefulness of our non-GAAP financial measures and key performance measures as tools for comparison. We urge you to review the reconciliation of our non-GAAP financial measures and key performance measures to the most directly comparable GAAP financial measures included below in the tables captioned “Reconciliation of Revenue to Billings,” “Reconciliation of GAAP to Non-GAAP Profit Measures,” and “Reconciliation of GAAP Net Cash (Used In) Provided By Operating Activities to Non-GAAP Free Cash Flow,” and not to rely on any single financial measure to evaluate our business.
Forward Looking Statements
This press release contains express and implied forward-looking statements, including but not limited to statements relating to our competitive differentiation, our plans and expectations relating to product features and technology that are under development or in process, and capabilities of such product features and technology, our plans to introduce product features in future releases, our plans and expectations relating to our relationship with
About
© 2017
| NUTANIX, INC. | ||||||||||
| CONDENSED CONSOLIDATED BALANCE SHEETS | ||||||||||
| (In thousands, unaudited) | ||||||||||
| As of | ||||||||||
| July 31, | July 31, | |||||||||
| 2016 | 2017 | |||||||||
| Assets | ||||||||||
| Current assets: | ||||||||||
| Cash and cash equivalents | $ | 99,209 | $ | 138,359 | ||||||
| Short-term investments | 85,991 | 210,694 | ||||||||
| Accounts receivable—net | 110,659 | 178,876 | ||||||||
| Deferred commissions—current | 17,864 | 27,679 | ||||||||
| Prepaid expenses and other current assets | 16,138 | 28,362 | ||||||||
| Total current assets | 329,861 | 583,970 | ||||||||
| Property and equipment—net | 42,218 | 58,072 | ||||||||
| Deferred commissions—non-current | 19,029 | 33,709 | ||||||||
| Intangible assets—net | — | 26,001 | ||||||||
| Goodwill | — | 16,672 | ||||||||
| Other assets—non-current | 7,978 | 7,649 | ||||||||
| Total assets | $ | 399,086 | $ | 726,073 | ||||||
| Liabilities, Convertible Preferred Stock and Stockholders’ (Deficit) Equity | ||||||||||
| Current liabilities: | ||||||||||
| Accounts payable | $ | 52,111 | $ | 73,725 | ||||||
| Accrued compensation and benefits | 24,547 | 57,521 | ||||||||
| Accrued expenses and other liabilities | 5,537 | 9,414 | ||||||||
| Deferred revenue—current | 130,569 | 233,498 | ||||||||
| Total current liabilities | 212,764 | 374,158 | ||||||||
| Deferred revenue—non-current | 165,896 | 292,573 | ||||||||
| Senior notes | 73,260 | — | ||||||||
| Convertible preferred stock warrant liability | 9,679 | — | ||||||||
| Early exercised stock options liability | 2,320 | 851 | ||||||||
| Other liabilities—non-current | 1,103 | 10,289 | ||||||||
| Total liabilities | 465,022 | 677,871 | ||||||||
| Commitments and contingencies | ||||||||||
| Convertible preferred stock | 310,379 | — | ||||||||
| Stockholders’ (deficit) equity: | ||||||||||
| Common stock | 1 | 4 | ||||||||
| Additional paid-in capital | 65,629 | 948,134 | ||||||||
| Accumulated other comprehensive loss | (12 | ) | (106 | ) | ||||||
| Accumulated deficit | (441,933 | ) | (899,830 | ) | ||||||
| Total stockholders’ (deficit) equity | (376,315 | ) | 48,202 | |||||||
| Total liabilities, convertible preferred stock and stockholders’ (deficit) equity | $ | 399,086 | $ | 726,073 | ||||||
| NUTANIX, INC. | ||||||||||||||||||||
| CONDENSED CONSOLIDATED STATEMENTS OF OPERATIONS | ||||||||||||||||||||
| (In thousands, except share and per share data, unaudited) | ||||||||||||||||||||
| Three Months Ended | Fiscal Year Ended | |||||||||||||||||||
| July 31, | July 31, | |||||||||||||||||||
| 2016 | 2017 | 2016 | 2017 | |||||||||||||||||
| Revenue: | ||||||||||||||||||||
| Product | $ | 109,216 | $ | 171,704 | $ | 350,798 | $ | 583,011 | ||||||||||||
| Support and other services | 30,569 | 54,398 | 94,130 | 183,858 | ||||||||||||||||
| Total revenue | 139,785 | 226,102 | 444,928 | 766,869 | ||||||||||||||||
| Cost of revenue: | ||||||||||||||||||||
| Product (1)(2) | 42,480 | 76,187 | 133,541 | 249,393 | ||||||||||||||||
| Support and other services (1) | 11,899 | 21,330 | 37,246 | 77,938 | ||||||||||||||||
| Total cost of revenue | 54,379 | 97,517 | 170,787 | 327,331 | ||||||||||||||||
| Gross profit | 85,406 | 128,585 | 274,141 | 439,538 | ||||||||||||||||
| Operating expenses: | ||||||||||||||||||||
| Sales and marketing (1)(2) | 87,917 | 132,503 | 288,493 | 500,529 | ||||||||||||||||
| Research and development (1) | 35,129 | 67,817 | 116,400 | 288,619 | ||||||||||||||||
| General and administrative (1) | 10,289 | 16,878 | 34,265 | 77,341 | ||||||||||||||||
| Total operating expenses | 133,335 | 217,198 | 439,158 | 866,489 | ||||||||||||||||
| Loss from operations | (47,929 | ) | (88,613 | ) | (165,017 | ) | (426,951 | ) | ||||||||||||
| Other income (expense)—net | (959 | ) | (547 | ) | (1,290 | ) | (26,377 | ) | ||||||||||||
| Loss before provision for income taxes | (48,888 | ) | (89,160 | ) | (166,307 | ) | (453,328 | ) | ||||||||||||
| Provision for income taxes | 1,041 | 1,493 | 2,192 | 4,683 | ||||||||||||||||
| Net loss | $ | (49,929 | ) | $ | (90,653 | ) | $ | (168,499 | ) | $ | (458,011 | ) | ||||||||
| Net loss per share attributable to common stockholders—basic and diluted | $ | (1.11 | ) | $ | (0.59 | ) | $ | (3.83 | ) | $ |
(3.57 |
) | ||||||||
| Weighted-average shares used in computing net loss per share attributable to common stockholders—basic and diluted | 44,934,140 | 152,581,557 | 43,970,381 |
128,295,563 |
||||||||||||||||
| (1) |
Includes the following stock-based compensation expense: |
| Three Months Ended | Fiscal Year Ended | ||||||||||||||||||
| July 31, | July 31, | ||||||||||||||||||
| 2016 | 2017 | 2016 | 2017 | ||||||||||||||||
| Product cost of sales | $ | 80 | $ | 642 | $ | 391 | $ | 3,066 | |||||||||||
| Support cost of sales | 204 | 2,201 | 968 | 10,411 | |||||||||||||||
| Sales and marketing | 1,895 | 12,972 | 8,006 | 78,117 | |||||||||||||||
| Research and development | 1,499 | 19,218 | 6,259 | 109,044 | |||||||||||||||
| General and administrative | 998 | 2,772 | 4,432 | 30,853 | |||||||||||||||
| Total stock-based compensation expense | $ | 4,676 | $ | 37,805 | $ | 20,056 | $ | 231,491 | |||||||||||
| (2) | Includes the following amortization of intangible assets: |
| Three Months Ended | Fiscal Year Ended | ||||||||||||||||||
| July 31, | July 31, | ||||||||||||||||||
| 2016 | 2017 | 2016 | 2017 | ||||||||||||||||
| Product cost of sales | $ | — | $ | 358 | $ | — | $ | 1,314 | |||||||||||
| Sales and marketing | — | 250 | — | 915 | |||||||||||||||
| Total amortization of intangible assets | $ | — | $ | 608 | $ | — | $ | 2,229 | |||||||||||
| NUTANIX, INC. | ||||||||||
| CONDENSED CONSOLIDATED STATEMENTS OF CASH FLOWS | ||||||||||
| (In thousands, unaudited) | ||||||||||
| Year Ended | ||||||||||
| July 31, | ||||||||||
| 2016 | 2017 | |||||||||
| Cash flows from operating activities: | ||||||||||
| Net loss | $ | (168,499 | ) | $ | (458,011 | ) | ||||
| Adjustments to reconcile net loss to net cash provided by operating activities: | ||||||||||
| Depreciation and amortization | 26,408 | 38,399 | ||||||||
| Stock-based compensation | 20,056 | 231,491 | ||||||||
| Loss on debt extinguishment | — | 3,320 | ||||||||
| Change in fair value of convertible preferred stock warrant liability | (2,004 | ) | 21,133 | |||||||
| Change in fair value of contingent consideration | — | 1,924 | ||||||||
| Other | 129 | 764 | ||||||||
| Changes in operating assets and liabilities: | ||||||||||
| Accounts receivable—net | (71,406 | ) | (67,382 | ) | ||||||
| Deferred commission | (19,813 | ) | (24,495 | ) | ||||||
| Prepaid expenses and other assets | (3,460 | ) | (15,830 | ) | ||||||
| Accounts payable | 19,985 | 21,280 | ||||||||
| Accrued compensation and benefits | 10,709 | 32,687 | ||||||||
| Accrued expenses and other liabilities | (1,336 | ) | 4,944 | |||||||
| Deferred revenue | 192,867 | 223,598 | ||||||||
| Net cash provided by operating activities | 3,636 | 13,822 | ||||||||
| Cash flows from investing activities: | ||||||||||
| Purchases of property and equipment | (42,294 | ) | (50,181 | ) | ||||||
| Purchases of investments | (106,345 | ) | (242,525 | ) | ||||||
| Maturities of investments | 102,135 | 84,156 | ||||||||
| Sale of investments | — | 32,640 | ||||||||
| Payments for business acquisitions, net of cash acquired | — | (184 | ) | |||||||
| Net cash used in investing activities | (46,504 | ) | (176,094 | ) | ||||||
| Cash flows from financing activities: | ||||||||||
| Proceeds from initial public offering, net of underwriting discounts and commissions | — | 254,455 | ||||||||
| Payments of offering costs, net | (3,186 | ) | (1,660 | ) | ||||||
| Proceeds from sales of shares through employee equity incentive plans, net of repurchases | 3,149 | 32,254 | ||||||||
| Repayment of senior notes | — | (75,000 | ) | |||||||
| Debt extinguishment costs | — | (1,580 | ) | |||||||
| Payment of debt in conjunction with a business acquisition | — | (7,124 | ) | |||||||
| Proceeds from long-term debt - net of issuance costs | 73,255 | — | ||||||||
| Other | 980 | 77 | ||||||||
| Net cash provided by financing activities | 74,198 | 201,422 | ||||||||
| Net increase in cash and cash equivalents | 31,330 | 39,150 | ||||||||
| Cash and cash equivalents—beginning of period | 67,879 | 99,209 | ||||||||
| Cash and cash equivalents—end of period | $ | 99,209 | $ | 138,359 | ||||||
| Supplemental disclosures of cash flow information: | ||||||||||
| Cash paid for income taxes | $ | 2,455 | $ | 5,213 | ||||||
| Cash paid for interest | $ | 2,188 | $ | 1,271 | ||||||
| Supplemental disclosures of non-cash investing and financing information: | ||||||||||
| Vesting of early exercised stock options | $ | 3,205 | $ | 1,614 | ||||||
| Purchases of property and equipment included in accounts payable | $ | 5,007 | $ | 5,591 | ||||||
| Offering costs included in accounts payable | $ | 902 | $ | 85 | ||||||
| Conversion of convertible preferred stock to common stock, net of issuance costs | $ | — | $ | 310,379 | ||||||
| Reclassification of convertible preferred stock warrant liability to additional paid-in capital | $ | — | $ | 30,812 | ||||||
| Issuance of common stock for business acquisitions | $ | — | $ | 27,063 | ||||||
| Reconciliation of Revenue to Billings | |||||||||||||||||||
| (In thousands, unaudited) | |||||||||||||||||||
| Three Months Ended | Fiscal Year Ended | ||||||||||||||||||
| July 31, | July 31, | ||||||||||||||||||
| 2016 | 2017 | 2016 | 2017 | ||||||||||||||||
| Total revenue | $ | 139,785 | $ | 226,102 | $ | 444,928 | $ | 766,869 | |||||||||||
| Change in deferred revenue, net of acquisitions (1) | 66,843 | 63,071 | 192,867 | 223,598 | |||||||||||||||
| Billings | $ | 206,628 | $ | 289,173 | $ | 637,795 | $ | 990,467 | |||||||||||
| (1) | Fiscal 2017 excludes $6.0 million of deferred revenue assumed in the PernixData acquisition. | ||
| Reconciliation of GAAP to Non-GAAP Profit Measures | ||||||||||||||||||||||||||||||
| (In thousands, except share and per share data, unaudited) | ||||||||||||||||||||||||||||||
| GAAP | Non-GAAP Adjustments | Non-GAAP | ||||||||||||||||||||||||||||
|
Three |
Three |
|||||||||||||||||||||||||||||
|
Months |
Months |
|||||||||||||||||||||||||||||
|
Ended July |
Ended July |
|||||||||||||||||||||||||||||
| 31, 2017 | (1) | (2) | (3) | (4) | 31, 2017 | |||||||||||||||||||||||||
| Gross profit | $ | 128,585 | $ | 2,843 | $ | 358 | $ | — | $ | — | $ | 131,786 | ||||||||||||||||||
| Gross margin | 56.9 | % |
1.2 |
% | 0.2 | % | — |
58.3 |
% | |||||||||||||||||||||
| Operating expenses: | ||||||||||||||||||||||||||||||
| Sales and marketing | 132,503 | (12,972 | ) | (250 | ) | — | 119,281 | |||||||||||||||||||||||
| Research and development | 67,817 | (19,218 | ) | — | — | 48,599 | ||||||||||||||||||||||||
| General and administrative | 16,878 | (2,772 | ) | — | (1,748 | ) | 12,358 | |||||||||||||||||||||||
| Total operating expenses | 217,198 | (34,962 | ) | (250 | ) | (1,748 | ) | $ | — | 180,238 | ||||||||||||||||||||
| Loss from operations | (88,613 | ) | 37,805 | 608 | 1,748 | $ | — | (48,452 | ) | |||||||||||||||||||||
| Net loss | $ | (90,653 | ) | $ | 37,805 | $ | 608 | $ | 1,748 | $ | (78 | ) | $ | (50,570 | ) | |||||||||||||||
| Weighted-shares outstanding, basic and diluted | 152,581,557 | 152,581,557 | ||||||||||||||||||||||||||||
| Net loss per share, basic and diluted | $ | (0.59 | ) | $ | 0.25 | $ | 0.01 | $ | — | $ | — | $ | (0.33 | ) | ||||||||||||||||
|
(1) |
Stock-based compensation expense |
||
|
(2) |
Amortization of intangible assets |
||
|
(3) |
Change in fair value of contingent consideration assumed in the PernixData acquisition |
||
|
(4) |
Tax effect of stock-based compensation expense |
| GAAP | Non-GAAP Adjustments | Non-GAAP | ||||||||||||||||||
|
|
|
|||||||||||||||||||
|
Three Months |
Three Months |
|||||||||||||||||||
|
Ended July 31, |
Ended July 31, |
|||||||||||||||||||
|
2016 |
(1) | (2) |
2016 |
|||||||||||||||||
| Gross profit | $ | 85,406 | $ | 284 | $ | — | $ | 85,690 | ||||||||||||
| Gross margin | 61.1 | % | 0.2 | % | — | % | 61.3 | % | ||||||||||||
| Operating expenses: | ||||||||||||||||||||
| Sales and marketing | 87,917 | (1,895 | ) | — | 86,022 | |||||||||||||||
| Research and development | 35,129 | (1,499 | ) | — | 33,630 | |||||||||||||||
| General and administrative | 10,289 | (998 | ) | — | 9,291 | |||||||||||||||
| Total operating expenses | 133,335 | (4,392 | ) | — | 128,943 | |||||||||||||||
| Loss from operations | (47,929 | ) | 4,676 | — | (43,253 | ) | ||||||||||||||
| Net loss | $ | (49,929 | ) | $ | 4,676 | $ | (1,437 | ) | $ | (46,690 | ) | |||||||||
| Weighted-shares outstanding, basic and diluted | 44,934,140 | 44,934,140 | ||||||||||||||||||
| Pro forma adjustment | 76,319,511 | 76,319,511 | ||||||||||||||||||
| Pro forma weighted-shares outstanding, basic and diluted | 121,253,651 | 121,253,651 | ||||||||||||||||||
| Net loss per share, basic and diluted | $ | (1.11 | ) | |||||||||||||||||
| Pro forma net loss per share, basic and diluted * | $ | (0.41 | ) | $ | 0.04 | $ | (0.01 | ) | $ | (0.39 | ) | |||||||||
|
(1) |
Stock-based compensation expense |
||
|
(2) |
Change in fair value of preferred stock warrant liability |
||
| GAAP | Non-GAAP Adjustments | Non-GAAP | |||||||||||||||||||||||||||||||||||||||||||
| Fiscal Year | Fiscal Year | ||||||||||||||||||||||||||||||||||||||||||||
| Ended July | Ended July | ||||||||||||||||||||||||||||||||||||||||||||
| 31, 2017 | (1) | (2) | (3) | (4) | (5) | (6) | (7) | 31, 2017 | |||||||||||||||||||||||||||||||||||||
| Gross profit | $ | 439,538 | $ | 13,477 | $ | 1,314 | $ | — | $ | — | $ | — | $ | — | $ | — | $ | 454,329 | |||||||||||||||||||||||||||
| Gross margin | 57.3 | % | 1.7 | % | 0.2 | % | — | % | — | % | — | % | — | % | — | % | 59.2 | % | |||||||||||||||||||||||||||
| Operating expenses: | |||||||||||||||||||||||||||||||||||||||||||||
| Sales and marketing | 500,529 | (78,117 | ) | (915 | ) | — | — | — | — | — | 421,497 | ||||||||||||||||||||||||||||||||||
| Research and development | 288,619 | (109,044 | ) | — | — | — | — | — | — | 179,575 | |||||||||||||||||||||||||||||||||||
| General and administrative | 77,341 | (30,853 | ) | — | (1,924 | ) | (672 | ) | — | — | — | 43,892 | |||||||||||||||||||||||||||||||||
| Total operating expenses | 866,489 | (218,014 | ) | (915 | ) | (1,924 | ) | (672 | ) | — | — | — | 644,964 | ||||||||||||||||||||||||||||||||
| Loss from operations | (426,951 | ) | 231,491 | 2,229 | 1,924 | 672 | — | — | — | (190,635 | ) | ||||||||||||||||||||||||||||||||||
| Net loss | $ | (458,011 | ) | $ | 231,491 | $ | 2,229 | $ | 1,924 | $ | 672 | $ | 21,133 | $ | 3,320 | $ | (1,846 | ) | $ | (199,088 | ) | ||||||||||||||||||||||||
| Weighted-shares outstanding, basic and diluted |
128,295,563 |
128,295,563 |
|||||||||||||||||||||||||||||||||||||||||||
| Pro forma adjustment | 13,418,815 | 13,418,815 | |||||||||||||||||||||||||||||||||||||||||||
| Pro forma weighted-shares outstanding, basic and diluted |
141,714,378 |
141,714,378 |
|||||||||||||||||||||||||||||||||||||||||||
| Net loss per share, basic and diluted | $ |
(3.57 |
) | ||||||||||||||||||||||||||||||||||||||||||
| Pro forma net loss per share, basic and diluted * | $ |
(3.23 |
) | $ |
1.63 |
$ | 0.02 | $ | 0.01 | $ | 0.01 | $ | 0.15 | $ | 0.02 | $ | (0.01 | ) | $ |
(1.40 |
) | ||||||||||||||||||||||||
|
(1) |
Stock-based compensation expense |
||
|
(2) |
Amortization of intangible assets |
||
|
(3) |
Change in fair value of contingent consideration assumed in the PernixData acquisition |
||
|
(4) |
Acquisition-related costs |
||
|
(5) |
Change in fair value of preferred stock warrant liability |
||
|
(6) |
Loss on debt extinguishment |
||
|
(7) |
Partial release of valuation allowance from the PernixData acquisition and tax effect of stock-based compensation expense |
||
| GAAP | Non-GAAP Adjustments | Non-GAAP | ||||||||||||||||||
| Fiscal Year | Fiscal Year | |||||||||||||||||||
| Ended July | Ended July | |||||||||||||||||||
| 31, 2016 | (1) | (2) | 31, 2016 | |||||||||||||||||
| Gross profit | $ | 274,141 | $ | 1,359 | $ | — | $ | 275,500 | ||||||||||||
| Gross margin | 61.6 | % | 0.3 | % | — | % | 61.9 | % | ||||||||||||
| Operating expenses: | ||||||||||||||||||||
| Sales and marketing | 288,493 | (8,006 | ) | — | 280,487 | |||||||||||||||
| Research and development | 116,400 | (6,259 | ) | — | 110,141 | |||||||||||||||
| General and administrative | 34,265 | (4,432 | ) | — | 29,833 | |||||||||||||||
| Total operating expenses | 439,158 | (18,697 | ) | — | 420,461 | |||||||||||||||
| Loss from operations | (165,017 | ) | 20,056 | — | (144,961 | ) | ||||||||||||||
| Net loss | $ | (168,499 | ) | $ | 20,056 | $ | (2,004 | ) | $ | (150,447 | ) | |||||||||
| Weighted-shares outstanding, basic and diluted | 43,970,381 | 43,970,381 | ||||||||||||||||||
| Pro forma adjustment | 76,319,511 | 76,319,511 | ||||||||||||||||||
| Pro forma weighted-shares outstanding, basic and diluted | 120,289,892 | 120,289,892 | ||||||||||||||||||
| Net loss per share, basic and diluted | $ | (3.83 | ) | |||||||||||||||||
| Pro forma net loss per share, basic and diluted * | $ | (1.40 | ) | $ | 0.17 | $ | (0.02 | ) | $ | (1.25 | ) | |||||||||
|
(1) |
Stock-based compensation expense |
||
|
(2) |
Change in fair value of preferred stock warrant liability |
||
|
*Pro forma non-GAAP basic and diluted net loss per share was computed to give effect to the conversion of all outstanding convertible preferred stock upon closing of our initial public offering on October 5, 2016, as if the conversion had occurred at the beginning of the period. |
| Reconciliation of GAAP Net Cash Provided By Operating Activities to Non-GAAP Free Cash Flow | ||||||||||||||||||||
| (In thousands, unaudited) | ||||||||||||||||||||
| Three Months Ended | Fiscal Year Ended | |||||||||||||||||||
| July 31, | July 31, | |||||||||||||||||||
| 2016 | 2017 | 2016 | 2017 | |||||||||||||||||
| Net cash provided by operating activities | $ | 2,366 | $ | 5,919 | $ | 3,636 | $ | 13,822 | ||||||||||||
| Purchase of property and equipment | (8,875 | ) | (12,384 | ) | (42,294 | ) | (50,181 | ) | ||||||||||||
| Free cash flow | $ | (6,509 | ) | $ | (6,465 | ) | $ | (38,658 | ) | $ | (36,359 | ) | ||||||||
View source version on businesswire.com: http://www.businesswire.com/news/home/20170831006099/en/
Source:
Nutanix, Inc.
Investor Contact:
Tonya Chin, 408-560-2675
tonya@nutanix.com
or
Media Contact:
Kate Reed, 973-534-9292
kreed@nutanix.com