Nutanix Reports First Quarter Fiscal 2019 Financial Results
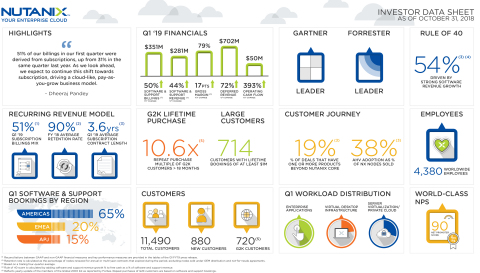
--Software and Support Billings Grow 50% YoY to $351 Million
--Company Evolves Toward a Recurring Revenue Model with 51% of Billings from Subscriptions--Up from 31% in the Year-Ago Period
--Subscription Revenue Up 104% YoY to $127 Million
SAN JOSE, Calif.--(BUSINESS WIRE)-- Nutanix, Inc. (NASDAQ: NTNX), a leader in enterprise cloud computing, today announced financial results for its first quarter of fiscal 2019, ended October 31, 2018.
This press release features multimedia. View the full release here: https://www.businesswire.com/news/home/20181127005687/en/
(Graphic: Business Wire)
(Graphic: Business Wire)
Q1 Fiscal 2019 Financial Highlights
- Revenue: $313.3 million (at 78.6% non-GAAP gross margin), up from $275.6 million (at 61.9% non-GAAP gross margin) in the first quarter of fiscal 2018. This reflects the elimination of approximately $104 million in pass-through hardware revenue in the first quarter of fiscal 2019, up from $8 million in the first quarter of fiscal 2018, as the company nears the completion of its shift toward increasing software revenue1
- Billings: $383.6 million, up from $315.3 million in the first quarter of fiscal 2018. This reflects the elimination of approximately $104 million in pass-through hardware revenue in the first quarter of fiscal 2019, up from $8 million in the first quarter of fiscal 2018, as the company nears the completion of its shift toward increasing software revenue1
- Software and Support Revenue: $280.7 million, growing 44% year-over-year from $194.7 million in the first quarter of fiscal 2018
- Software and Support Billings: $351.0 million, growing 50% year-over-year from $234.5 million in the first quarter of fiscal 2018
- Gross Margin: GAAP gross margin of 76.3%, up from 60.6% in the first quarter of fiscal 2018; Non-GAAP gross margin of 78.6%, up from 61.9% in the first quarter of fiscal 2018
- Net Loss: GAAP net loss of $94.3 million, compared to a GAAP net loss of $61.5 million in the first quarter of fiscal 2018; Non-GAAP net loss of $23.7 million, compared to a non-GAAP net loss of $24.7 million in the first quarter of fiscal 2018
- Net Loss Per Share: GAAP net loss per share of $0.54, compared to a GAAP net loss per share of $0.39 in the first quarter of fiscal 2018; Non-GAAP net loss per share of $0.13, compared to a non-GAAP net loss per share of $0.16 in the first quarter of fiscal 2018
- Cash and Short-term Investments: $965.0 million, up 164% from the first quarter of fiscal 2018
- Deferred Revenue: $701.8 million, up 72% from the first quarter of fiscal 2018
- Operating Cash Flow: $49.8 million, compared to $10.1 million in the first quarter of fiscal 2018
- Free Cash Flow: $20.0 million, compared to negative free cash flow of $7.9 million in the first quarter of fiscal 2018
Reconciliations between GAAP and non-GAAP financial measures and key performance measures are provided in the tables of this press release.
“Our results this quarter prove that our core business continues to grow strongly and put us on a solid path to meet our goal of at least $3 billion in software and support billings by 2021,” said Dheeraj Pandey, Chairman, Founder and CEO of Nutanix. “51% of our billings in our first quarter were derived from subscriptions, up from 31% in the same quarter last year, and our subscription revenue grew 104% year-over-year. As we look ahead, we expect to continue this shift towards subscription, driving a cloud-like, pay-as-you-grow business model.”
Recent Company Highlights
- Announces General Availability for Xi Leap Disaster Recovery Service: After successfully completing its evaluation period with early access customers, Nutanix has made its Xi Leap disaster recovery service generally available to all customers, signing several customers in the first few weeks of introduction.
- Expanded Customer Base: Nutanix ended the first quarter of fiscal 2019 with 11,490 end-customers. First quarter results included deals with ABN AMRO Clearing Bank, AccorHotels, Airbus, Inchcape plc, JSE Limited, Shinsei Bank, Limited, Wintrust Financial Corporation and more.
- Named a Leader in “The Forrester Wave: Hyperconverged Infrastructure, Q3 2018”: Nutanix believes that the designation as leader, combined with its history of high rankings in analyst research, further solidifies its place as a continued market leader across enterprise cloud and hyperconverged infrastructure.
- Released Results of Enterprise Cloud Index, Validating Hybrid Cloud Strategy: Conducted a Global IT Research Survey of 2,300 IT buyers that clearly shows that public cloud only is not the preferred state for IT, with 91% of respondents claiming that hybrid cloud is the ideal IT model. This research found that cloud interoperability and app mobility were of higher concern to IT professionals when considering hybrid cloud benefits than cost and security.
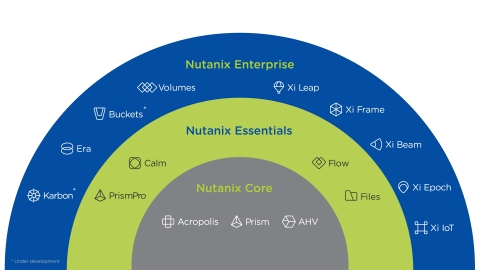
- Introduces the Nutanix Customer Journey: Nutanix today outlined new stages of the customer journey to help customers determine what products and solutions are best suited for their needs: beginning with Nutanix Coreto modernize and deliver a cloud-like experience within the walls of their datacenters; Nutanix Essentials builds on the company’s Core HCI offering to deliver even more automation and IT efficiency; and culminating in Nutanix Enterprise to enable customers to advance into hybrid and multicloud deployments with offerings including Xi Cloud Services.
- Launched New Beam Functionality Extending its Capabilities to the Private Cloud: Newly introduced Beam features extend its cost visibility and optimization capabilities into Nutanix on-prem deployments. With this new update, Beam customers get full visibility and insight into the entirety of their infrastructure environment, including public and private clouds, so they can choose the right cloud for every application.
- Achieved FedRAMP Ready Designation for Nutanix Frame: Nutanix Frame was grantedFederal Risk and Authorization Management Program (FedRAMP) Ready designation for the Nutanix Frame for Government platform to deliver secure application workspaces on U.S. government approved clouds.
- Announces New Xi Cloud Services for the Modern Multicloud Era at .NEXT London Conference: Introduces the general availability of Xi Cloud Services, a new suite of offerings designed to create a more unified fabric across different cloud environments, giving IT teams the freedom to run their applications on the optimal platform. Xi Cloud Services is comprised of five distinct offerings at launch, including Xi Leap, a native extension of the Nutanix Enterprise Cloud Platform providing disaster recovery as a service, and Xi IoT, an intelligent edge computing platform.
Q2 Fiscal 2019 Financial Outlook
For the second quarter of fiscal 2019, Nutanix expects:
- Revenue between $325 and $335 million;
- Billings between $410 and $420 million;
- Non-GAAP gross margin between 78% and 79%;
- Non-GAAP operating expenses between $300 and $310 million; and
- Non-GAAP loss per share of approximately $0.25, using approximately 180 million weighted shares outstanding
1The elimination of hardware revenue is based on the estimated cost of hardware in transactions where our customers purchase such hardware directly from our contract manufacturers.
Supplementary materials to this earnings release, including the company’s first quarter fiscal 2019 investor presentation, can be found at https://ir.nutanix.com/company/financial.
All forward-looking non-GAAP financial measures contained in the section titled "Q2 Fiscal 2019 Financial Outlook" exclude stock-based compensation expense and amortization of intangible assets and may also exclude, as applicable, other special items. The company has not reconciled guidance for non-GAAP gross margin, non-GAAP operating expenses and non-GAAP loss per share to their most directly comparable GAAP measures because such items that impact these measures are not within its control and are subject to constant change. While the actual amounts of such items will have a significant impact on the company’s non-GAAP gross margin, non-GAAP operating expenses and non-GAAP loss per share, a reconciliation of the non-GAAP financial measure guidance to the corresponding GAAP measures is not available without unreasonable effort.
Webcast and Conference Call Information
Nutanix executives will discuss the company’s first quarter fiscal 2019 financial results on a conference call at 4:30 p.m. Eastern Time/1:30 p.m. Pacific Time today. To listen to the call via telephone, dial 1-833-227-5841 in the United States or 1-647-689-4068 from outside the United States. The conference ID is 7496942. This call will be webcast live and available to all interested parties on our Investor Relations website at ir.nutanix.com. Shortly after the conclusion of the conference call, a replay of the audio webcast will be available on the Nutanix Investor Relations website. A telephonic replay will be available for one week by calling 1-800-585-8367 or 1-416-621-4642, and entering the conference ID 7496942.
Non-GAAP Financial Measures and Other Key Performance Measures
To supplement our condensed consolidated financial statements, which are prepared and presented in accordance with GAAP, we use the following non-GAAP financial and other key performance measures: billings, non-GAAP gross margin, non-GAAP operating expenses, non-GAAP net loss, pro forma non-GAAP net loss per share, free cash flow, software and support revenue, software and support billings, and subscription and professional services billings. In computing these non-GAAP financial measures and key performance measures, we exclude certain items such as stock-based compensation and the related income tax impact, costs associated with our acquisitions (such as amortization of acquired intangible assets, revaluation of contingent consideration, income tax-related impact, and other acquisition-related costs), amortization of debt discount and issuance costs, other non-recurring transactions and the related tax impact and the revenue and billings associated with pass-through hardware sales. Billings is a performance measure which our management believes provides useful information to investors because it represents the amounts under binding purchase orders received by us during a given period that have been billed, and we calculate billings by adding the change in deferred revenue between the start and end of the period to total revenue recognized in the same period. Free cash flow is a performance measure that our management believes provides useful information to management and investors about the amount of cash generated by the business after necessary capital expenditures, and we define free cash flow as net cash (used in) provided by operating activities less purchases of property and equipment. Non-GAAP gross margin, non-GAAP operating expenses, non-GAAP net loss, and pro forma non-GAAP net loss per share are financial measures which our management believes provide useful information to investors because they provide meaningful supplemental information regarding our performance and liquidity by excluding certain expenses and expenditures such as stock-based compensation expense that may not be indicative of our ongoing core business operating results. Software and support revenue and software and support billings are performance measures that our management believes provide useful information to our management and investors as it allows us to better track the true growth of our software business by excluding the amounts attributable to the pass-through hardware sales that we use to deliver our solutions. Subscription and professional services billings are performance measures that our management believes provide useful information to our management and investors as it allows us to better track the growth of the subscription-based portion of our business, which is a critical part of our business plan. We use these non-GAAP financial and key performance measures for financial and operational decision-making and as a means to evaluate period-to-period comparisons. However, these non-GAAP financial and key performance measures have limitations as analytical tools and you should not consider them in isolation or as substitutes for analysis of our results as reported under GAAP. Billings, non-GAAP gross margin, non-GAAP operating expenses, non-GAAP net loss, pro forma non-GAAP net loss per share, and free cash flow are not substitutes for total revenue, gross margin, operating expenses, net loss, net loss per share, or net cash (used in) provided by operating activities, respectively, software and support revenue and software and support billings are not substitutes for total revenue, and subscription and professional services billings are not a substitute for subscription and professional services revenue. In addition, other companies, including companies in our industry, may calculate non-GAAP financial measures and key performance measures differently or may use other measures to evaluate their performance, all of which could reduce the usefulness of our non-GAAP financial measures and key performance measures as tools for comparison. We urge you to review the reconciliation of our non-GAAP financial measures and key performance measures to the most directly comparable GAAP financial measures included below in the tables captioned “Reconciliation of Revenue to Billings,” “Disaggregation of Revenue and Billings,” “Reconciliation of Subscription and Professional Services Revenue to Subscription and Professional Services Billings,” “Reconciliation of Software and Support Revenue to Software and Support Billings,” “Reconciliation of GAAP to Non-GAAP Profit Measures,” and “Reconciliation of GAAP Net Cash (Used In) Provided By Operating Activities to Non-GAAP Free Cash Flow,” and not to rely on any single financial measure to evaluate our business.
Forward-Looking Statements
This press release contains express and implied forward-looking statements, including, but not limited to, statements regarding our business plans and objectives, long-term financial model targets and our plans to achieve those targets, product features, services and technology that are under development or in process and capabilities of such product features, services and technology, our total addressable market, our continued investment in talent and technology, plans and timing for, and the impact of, our transition to a software-defined and subscription-based business model, and anticipated future financial results, including but not limited to our guidance on estimated revenues, billings, non-GAAP gross margin, non-GAAP operating expenses and non-GAAP net loss per share for future fiscal periods. These forward-looking statements are not historical facts and instead are based on our current expectations, estimates, opinions, and beliefs. Consequently, you should not rely on these forward-looking statements. The accuracy of such forward-looking statements depends upon future events and involves risks, uncertainties, and other factors beyond our control that may cause these statements to be inaccurate and cause our actual results, performance or achievements to differ materially and adversely from those anticipated or implied by such statements, including, among others: failure to develop, or unexpected difficulties or delays in developing, new products, services, product features or technology in a timely or cost-effective basis; delays in or lack of customer or market acceptance of our new products, services, product features or technology; delays in the transition to focus primarily on software-only transactions and a subscription-based business model; the rapid evolution of the markets in which we compete; our ability to sustain or manage future growth effectively; factors that could result in the significant fluctuation of our future quarterly operating results, including, among other things, anticipated changes to our revenue and product mix which will slow revenue growth during such transition and make forecasting future performance more difficult, unanticipated challenges in the integration of recently acquired companies, the timing and magnitude of orders, shipments and acceptance of our solutions in any given quarter, our ability to attract new and retain existing end-customers, changes in the pricing of certain components of our solutions, and fluctuations in demand and competitive pricing pressures for our solutions; the introduction, or acceleration of adoption of, competing solutions, including public cloud infrastructure; and other risks detailed in our annual report on Form 10-K for the fiscal year ended July 31, 2018, filed with the SEC on September 24, 2018. Additional information will also be set forth in our Form 10-Q that will be filed for the quarter ended October 31, 2018, which should be read in conjunction with these financial results. Our SEC filings are available on the Investor Relations section of the company’s website at ir.nutanix.com and on the SEC's website at www.sec.gov. These forward-looking statements speak only as of the date of this press release and, except as required by law, we assume no obligation to update forward-looking statements to reflect actual results or subsequent events or circumstances.
About Nutanix
Nutanix is a global leader in cloud software and hyperconverged infrastructure solutions, making infrastructure invisible so that IT can focus on the applications and services that power their business. Companies around the world use Nutanix Enterprise Cloud OS platform to bring one-click application management and mobility across public, private and distributed edge clouds so they can run any application at any scale with a dramatically lower total cost of ownership. The result is organizations that can rapidly deliver a high-performance IT environment on demand, giving application owners a true cloud-like experience. Learn more at www.nutanix.com or follow us on Twitter @nutanix.
© 2018 Nutanix, Inc. All rights reserved. Nutanix, the Nutanix logo, Xi, and all product and service names mentioned herein are registered trademarks or trademarks of Nutanix, Inc. in the United States and other countries. All other brand names mentioned herein are for identification purposes only and may be the trademarks of their respective holder(s).
| NUTANIX, INC. | ||||||||||
| CONDENSED CONSOLIDATED BALANCE SHEETS | ||||||||||
| (Unaudited) | ||||||||||
| As of | ||||||||||
| July 31, | October 31, | |||||||||
| 2018 | 2018 | |||||||||
| (in thousands) | ||||||||||
| Assets | ||||||||||
| Current assets: | ||||||||||
| Cash and cash equivalents | $ | 305,975 | $ | 399,786 | ||||||
| Short-term investments | 628,328 | 565,189 | ||||||||
| Accounts receivable, net | 258,289 | 237,682 | ||||||||
| Deferred commissions—current | 33,691 | 34,742 | ||||||||
| Prepaid expenses and other current assets | 36,818 | 39,621 | ||||||||
| Total current assets | 1,263,101 | 1,277,020 | ||||||||
| Property and equipment, net | 85,111 | 104,750 | ||||||||
| Deferred commissions—non-current | 80,688 | 87,365 | ||||||||
| Intangible assets, net | 45,366 | 79,830 | ||||||||
| Goodwill | 87,759 | 184,994 | ||||||||
| Other assets—non-current | 37,855 | 39,127 | ||||||||
| Total assets | $ | 1,599,880 | $ | 1,773,086 | ||||||
| Liabilities and Stockholders’ Equity | ||||||||||
| Current liabilities: | ||||||||||
| Accounts payable | $ | 65,503 | $ | 69,474 | ||||||
| Accrued compensation and benefits | 85,398 | 65,709 | ||||||||
| Accrued expenses and other current liabilities | 31,682 | 28,552 | ||||||||
| Deferred revenue—current | 275,648 | 307,195 | ||||||||
| Total current liabilities | 458,231 | 470,930 | ||||||||
| Deferred revenue—non-current | 355,559 | 394,605 | ||||||||
| Convertible senior notes, net | 429,598 | 436,745 | ||||||||
| Other liabilities—non-current | 29,713 | 39,487 | ||||||||
| Total liabilities | 1,273,101 | 1,341,767 | ||||||||
| Stockholders’ equity: | ||||||||||
| Common stock | 4 | 4 | ||||||||
| Additional paid-in capital | 1,355,907 | 1,554,878 | ||||||||
| Accumulated other comprehensive loss | (1,002 | ) | (1,168 | ) | ||||||
| Accumulated deficit | (1,028,130 | ) | (1,122,395 | ) | ||||||
| Total stockholders’ equity | 326,779 | 431,319 | ||||||||
| Total liabilities and stockholders’ equity | $ | 1,599,880 | $ | 1,773,086 | ||||||
| NUTANIX, INC. | ||||||||||
| CONDENSED CONSOLIDATED STATEMENTS OF OPERATIONS | ||||||||||
| (Unaudited) | ||||||||||
| Three Months Ended | ||||||||||
| October 31, | ||||||||||
| 2017 | 2018 | |||||||||
| (in thousands, except share and per share data) | ||||||||||
| Revenue: | ||||||||||
| Product | $ | 219,052 | $ | 224,346 | ||||||
| Support, entitlements and other services | 56,500 | 88,937 | ||||||||
| Total revenue | 275,552 | 313,283 | ||||||||
| Cost of revenue: | ||||||||||
| Product (1)(2) | 85,162 | 39,261 | ||||||||
| Support, entitlements and other services (1) | 23,460 | 34,845 | ||||||||
| Total cost of revenue | 108,622 | 74,106 | ||||||||
| Gross profit | 166,930 | 239,177 | ||||||||
| Operating expenses: | ||||||||||
| Sales and marketing (1)(2) | 145,405 | 196,497 | ||||||||
| Research and development (1) | 64,512 | 110,531 | ||||||||
| General and administrative (1) | 16,052 | 27,339 | ||||||||
| Total operating expenses | 225,969 | 334,367 | ||||||||
| Loss from operations | (59,039 | ) | (95,190 | ) | ||||||
| Other expense, net | (189 | ) | (2,703 | ) | ||||||
| Loss before provision for (benefit from) income taxes | (59,228 | ) | (97,893 | ) | ||||||
| Provision for (benefit from) income taxes | 2,259 | (3,628 | ) | |||||||
| Net loss | $ | (61,487 | ) | $ | (94,265 | ) | ||||
| Net loss per share attributable to Class A and Class B common stockholders—basic and diluted | $ | (0.39 | ) | $ | (0.54 | ) | ||||
| Weighted average shares used in computing net loss per share attributable to Class A and Class B common stockholders—basic and diluted | 156,780,631 | 175,445,969 | ||||||||
|
_____________________ |
|||
| (1) | Includes the following stock-based compensation expense: | ||
| Three Months Ended | |||||||||
| October 31, | |||||||||
| 2017 | 2018 | ||||||||
| (in thousands) | |||||||||
| Product cost of revenue | $ | 570 | $ | 698 | |||||
| Support, entitlements and other services cost of revenue | 2,072 | 3,157 | |||||||
| Sales and marketing | 13,766 | 22,606 | |||||||
| Research and development | 15,542 | 31,009 | |||||||
| General and administrative | 3,565 | 8,455 | |||||||
| Total stock-based compensation expense | $ | 35,515 | $ | 65,925 | |||||
|
_____________________ |
|||
| (2) |
Includes the following amortization of intangible assets: |
||
| Three Months Ended | |||||||||
| October 31, | |||||||||
| 2017 | 2018 | ||||||||
| (in thousands) | |||||||||
| Product cost of sales | $ | 895 | $ | 3,168 | |||||
| Sales and marketing | 211 | 550 | |||||||
| Total amortization of intangible assets | $ | 1,106 | $ | 3,718 | |||||
| NUTANIX, INC. | ||||||||||
| CONDENSED CONSOLIDATED STATEMENTS OF CASH FLOWS | ||||||||||
| (Unaudited) | ||||||||||
| Three Months Ended | ||||||||||
| October 31, | ||||||||||
| 2017 | 2018 | |||||||||
| (in thousands) | ||||||||||
| Cash flows from operating activities: | ||||||||||
| Net loss | $ | (61,487 | ) | $ | (94,265 | ) | ||||
| Adjustments to reconcile net loss to net cash provided by operating activities: | ||||||||||
|
Depreciation and amortization |
11,333 | 16,183 | ||||||||
| Stock-based compensation | 35,515 | 65,925 | ||||||||
| Amortization of debt discount and debt issuance costs | — | 7,148 | ||||||||
| Change in fair value of contingent consideration | 282 | (799 | ) | |||||||
| Other | 131 | (759 | ) | |||||||
| Changes in operating assets and liabilities: | ||||||||||
| Accounts receivable, net | 7,326 | 23,497 | ||||||||
| Deferred commissions | (8,457 | ) | (7,728 | ) | ||||||
| Prepaid expenses and other assets (1) | (316 | ) | (3,812 | ) | ||||||
| Accounts payable | (6,504 | ) | 1,292 | |||||||
| Accrued compensation and benefits | (7,220 | ) | (19,689 | ) | ||||||
| Accrued expenses and other liabilities | (293 | ) | (7,442 | ) | ||||||
| Deferred revenue | 39,788 | 70,273 | ||||||||
| Net cash provided by operating activities (1) | 10,098 | 49,824 | ||||||||
| Cash flows from investing activities: | ||||||||||
| Maturities of investments | 35,920 | 143,409 | ||||||||
| Purchases of investments | (59,108 | ) | (79,766 | ) | ||||||
| Purchases of property and equipment | (17,965 | ) | (29,832 | ) | ||||||
|
Payment for a business combination, net of cash and restricted cash acquired |
— | (18,662 | ) | |||||||
| Net cash (used in) provided by investing activities | (41,153 | ) | 15,149 | |||||||
| Cash flows from financing activities: | ||||||||||
| Proceeds from sales of shares through employee equity incentive plans, net of repurchases | 25,231 | 29,890 | ||||||||
| Payment of debt in conjunction with a business combination | — | (991 | ) | |||||||
| Payment of convertible notes issuance cost | — | (75 | ) | |||||||
| Payment of offering cost | (85 | ) | — | |||||||
| Net cash provided by financing activities | 25,146 | 28,824 | ||||||||
| Net (decrease) increase in cash, cash equivalents and restricted cash (1) | $ | (5,909 | ) | $ | 93,797 | |||||
| Cash, cash equivalents and restricted cash—beginning of period (1) | 139,497 | 307,098 | ||||||||
| Cash, cash equivalents and restricted cash—end of period (1) | $ | 133,588 | $ | 400,895 | ||||||
| Restricted cash (1) (2) | 1,129 | 1,109 | ||||||||
| Cash and cash equivalents—end of period | $ | 132,459 | $ | 399,786 | ||||||
| Supplemental disclosures of cash flow information: | ||||||||||
| Cash paid for income taxes | $ | 2,066 | $ | 3,910 | ||||||
| Supplemental disclosures of non-cash investing and financing information: | ||||||||||
| Issuance of common stock for business combinations | $ | — | $ | 102,978 | ||||||
| Purchases of property and equipment included in accounts payable and accrued liabilities | $ | 7,084 | $ | 15,717 | ||||||
| Vesting of early exercised stock options | $ | 249 | $ | 70 | ||||||
|
_____________________ |
|||
| (1) | During the first quarter of fiscal 2019, we adopted Accounting Standards Update (ASU) No. 2016-18, which requires that the statement of cash flows explain the change during the period in the total of cash, cash equivalents and restricted cash. We adopted the standard retrospectively for the prior period presented. Our adoption of ASU 2016-18 did not have any significant impact on our consolidated statement of cash flows. | ||
| (2) | Included within other assets—non-current in the condensed consolidated balance sheets. | ||
| NUTANIX, INC. | |||||||||
| Reconciliation of Revenue to Total Billings | |||||||||
| (Unaudited) | |||||||||
| Three Months Ended | |||||||||
| October 31, | |||||||||
| 2017 | 2018 | ||||||||
| (in thousands) | |||||||||
| Total revenue | $ | 275,552 | $ | 313,283 | |||||
| Change in deferred revenue, net of acquisitions (1) | 39,788 | 70,273 | |||||||
| Total billings | $ | 315,340 | $ | 383,556 | |||||
|
_____________________ |
|||
| (1) | Amount for the three months ended October 31, 2018 excludes approximately $0.3 million of deferred revenue assumed in the Frame acquisition. | ||
| Disaggregation of Revenue and Billings | |||||||||
| (Unaudited) | |||||||||
| Three Months Ended | |||||||||
| October 31, | |||||||||
| 2017 | 2018 | ||||||||
| (in thousands) | |||||||||
| Disaggregation of Revenue: | |||||||||
| Non-portable software | $ | 126,897 | $ | 146,570 | |||||
| Subscription | 62,376 | 126,976 | |||||||
| Hardware | 80,838 | 32,547 | |||||||
| Professional services | 5,441 | 7,190 | |||||||
| Total revenue | $ | 275,552 | $ | 313,283 | |||||
| Disaggregation of Billings: | |||||||||
| Non-portable software | $ | 126,897 | $ | 146,570 | |||||
| Subscription | 98,902 | 194,764 | |||||||
| Hardware | 80,838 | 32,547 | |||||||
| Professional services | 8,703 | 9,675 | |||||||
| Total billings | $ | 315,340 | $ | 383,556 | |||||
Non-portable software — Non-portable software revenue includes sales of our software operating system when delivered on a configured to order appliance by us, or one of our OEM partners. The software licenses associated with these sales are typically non-portable and have a term equal to the life of the appliance it is delivered on. Revenue from our non-portable software products is generally recognized upon transfer of control to the customer.
Subscription — Subscription revenue is generated from the sales of software entitlement and support subscriptions, separately purchased software term-based licenses and cloud-based Software as a Service, or SaaS offerings. We recognize revenue from software entitlement and support subscriptions and SaaS offerings ratably over the contractual service period, while revenue from our separately purchased software term-based licenses is generally recognized upon transfer of control to the customer, which is when we make the software available to our customers.
Hardware — In transactions where we deliver the hardware appliance, we consider ourselves to be the principal in the transaction and we record revenue and costs of goods sold on a gross basis. We consider the amount allocated to hardware revenue to be equivalent to the cost of the hardware procured. Hardware revenue is generally recognized upon transfer of control to the customer.
Professional services — We also sell professional services with our products. We recognize revenue related to professional services as they are performed.
| NUTANIX, INC. | |||||||||
| Reconciliation of Subscription and Professional Services Revenue to Subscription and Professional Services Billings | |||||||||
| (Unaudited) | |||||||||
| Three Months Ended | |||||||||
| October 31, | |||||||||
| 2017 | 2018 | ||||||||
| (in thousands) | |||||||||
| Subscription revenue | $ | 62,376 | $ | 126,976 | |||||
| Change in subscription deferred revenue, net of acquisitions (1) | 36,526 | 67,788 | |||||||
| Subscription billings | $ | 98,902 | $ | 194,764 | |||||
| Professional services revenue | $ | 5,441 | $ | 7,190 | |||||
| Change in professional services deferred revenue | 3,262 | 2,485 | |||||||
| Professional services billings | $ | 8,703 | $ | 9,675 | |||||
|
_____________________ |
|||
| (1) | Amount for the three months ended October 31, 2018 excludes approximately $0.3 million of deferred revenue assumed in the Frame acquisition. | ||
| Reconciliation of Software and Support Revenue to Software and Support Billings | |||||||||
| (Unaudited) | |||||||||
| Three Months Ended | |||||||||
| October 31, | |||||||||
| 2017 | 2018 | ||||||||
| (in thousands) | |||||||||
| Software revenue | $ | 138,214 | $ | 191,799 | |||||
| Hardware revenue | 80,838 | 32,547 | |||||||
| Product revenue | 219,052 | 224,346 | |||||||
| Support, entitlements and other services revenue | 56,500 | 88,937 | |||||||
| Total revenue | $ | 275,552 | $ | 313,283 | |||||
| Total software and support revenue (2) | $ | 194,714 | $ | 280,736 | |||||
| Change in software and support deferred revenue, net of acquisitions (1) | 39,788 | 70,273 | |||||||
| Software and support billings (2) | $ | 234,502 | $ | 351,009 | |||||
|
_____________________ |
|||
| (1) | Amount for the three months ended October 31, 2018 excludes approximately $0.3 million of deferred revenue assumed in the Frame acquisition. | ||
| (2) | Software and support revenue and billings include software and support, entitlements and other services revenue and billings. | ||
| NUTANIX, INC. | |||||||||||||||||||||||||||||||||||
| Reconciliation of GAAP to Non-GAAP Profit Measures | |||||||||||||||||||||||||||||||||||
| (Unaudited) | |||||||||||||||||||||||||||||||||||
| GAAP | Non-GAAP Adjustments | Non-GAAP | |||||||||||||||||||||||||||||||||
| Three Months | Three Months | ||||||||||||||||||||||||||||||||||
| Ended October | Ended October | ||||||||||||||||||||||||||||||||||
| 31, 2018 | (1) | (2) | (3) | (4) | (5) | (6) | 31, 2018 | ||||||||||||||||||||||||||||
| (in thousands, except share and per share data) | |||||||||||||||||||||||||||||||||||
| Gross profit | $ | 239,177 | $ | 3,855 | $ | 3,168 | $ | — | $ | — | $ | — | $ | — | $ | 246,200 | |||||||||||||||||||
| Gross margin | 76.3 | % | 1.2 | % | 1.1 | % | — | — | — | — | 78.6 | % | |||||||||||||||||||||||
| Operating expenses: | |||||||||||||||||||||||||||||||||||
| Sales and marketing | 196,497 | (22,606 | ) | (550 | ) | — | — | — | — | 173,341 | |||||||||||||||||||||||||
| Research and development | 110,531 | (31,009 | ) | — | — | — | — | — | 79,522 | ||||||||||||||||||||||||||
| General and administrative | 27,339 | (8,455 | ) | — | 799 | (481 | ) | — | — | 19,202 | |||||||||||||||||||||||||
| Total operating expenses | 334,367 | (62,070 | ) | (550 | ) | 799 | (481 | ) | — | — | 272,065 | ||||||||||||||||||||||||
| Loss from operations | (95,190 | ) | 65,925 | 3,718 | (799 | ) | 481 | — | — | (25,865 | ) | ||||||||||||||||||||||||
| Net loss | $ | (94,265 | ) | $ | 65,925 | $ | 3,718 | $ | (799 | ) | $ | 481 | $ | 7,148 | $ | (5,860 | ) | $ | (23,652 | ) | |||||||||||||||
| Weighted shares outstanding, basic and diluted | 175,445,969 | 175,445,969 | |||||||||||||||||||||||||||||||||
| Net loss per share, basic and diluted | $ | (0.54 | ) | $ | 0.38 | $ | 0.02 | $ | — | $ | — | $ | 0.04 | $ | (0.03 | ) | $ | (0.13 | ) | ||||||||||||||||
|
_____________________ |
|||
| (1) | Stock-based compensation expense | ||
| (2) | Amortization of intangible assets | ||
| (3) | Change in fair value of contingent consideration assumed in the PernixData acquisition | ||
| (4) | Acquisition-related costs | ||
| (5) | Amortization of debt discount and issuance costs | ||
| (6) | Partial release of valuation allowance from acquisition | ||
| GAAP | Non-GAAP Adjustments | Non-GAAP | |||||||||||||||||||||||||
| Three Months | Three Months | ||||||||||||||||||||||||||
| Ended October | Ended October | ||||||||||||||||||||||||||
| 31, 2017 | (1) | (2) | (3) | (4) | 31, 2017 | ||||||||||||||||||||||
| (in thousands, except share and per share data) | |||||||||||||||||||||||||||
| Gross profit | $ | 166,930 | $ | 2,642 | $ | 895 | $ | — | $ | — | $ | 170,467 | |||||||||||||||
| Gross margin | 60.6 | % | 1.0 | % | 0.3 | % | — | — | 61.9 | % | |||||||||||||||||
| Operating expenses: | |||||||||||||||||||||||||||
| Sales and marketing | 145,405 | (13,766 | ) | (211 | ) | — | — | 131,428 | |||||||||||||||||||
| Research and development | 64,512 | (15,542 | ) | — | — | — | 48,970 | ||||||||||||||||||||
| General and administrative | 16,052 | (3,565 | ) | — | (282 | ) | — | 12,205 | |||||||||||||||||||
| Total operating expenses | 225,969 | (32,873 | ) | (211 | ) | (282 | ) | — | 192,603 | ||||||||||||||||||
| Loss from operations | (59,039 | ) | 35,515 | 1,106 | 282 | — | (22,136 | ) | |||||||||||||||||||
| Net loss | $ | (61,487 | ) | $ | 35,515 | $ | 1,106 | $ | 282 | $ | (132 | ) | $ | (24,716 | ) | ||||||||||||
| Weighted shares outstanding, basic and diluted | 156,780,631 | 156,780,631 | |||||||||||||||||||||||||
| Net loss per share, basic and diluted | $ | (0.39 | ) | $ | 0.23 | $ | — | $ | — | $ | — | $ | (0.16 | ) | |||||||||||||
|
_____________________ |
|||
| (1) | Stock-based compensation expense | ||
| (2) | Amortization of intangible assets | ||
| (3) | Change in fair value of contingent consideration assumed in the PernixData acquisition | ||
| (4) | Income tax effect primarily related to stock-based compensation expense | ||
| NUTANIX, INC. | ||||||||||
| Reconciliation of GAAP Net Cash Provided by Operating Activities to Non-GAAP Free Cash Flow | ||||||||||
| (Unaudited) | ||||||||||
| Three Months Ended | ||||||||||
| October 31, | ||||||||||
| 2017 | 2018 | |||||||||
| (in thousands) | ||||||||||
| Net cash provided by operating activities | $ | 10,098 | $ | 49,824 | ||||||
| Purchases of property and equipment | (17,965 | ) | (29,832 | ) | ||||||
| Free cash flow | $ | (7,867 | ) | $ | 19,992 | |||||
View source version on businesswire.com: https://www.businesswire.com/news/home/20181127005687/en/
Investor Contact:
Tonya Chin
408-560-2675
tonya@nutanix.com
Media Contact:
Kate Reed
973-534-9292
kreed@nutanix.com
Source: Nutanix, Inc.