Nutanix Reports First Quarter Fiscal 2018 Financial Results
Increase in Federal Sales and
This press release features multimedia. View the full release here: http://www.businesswire.com/news/home/20171130006043/en/

First Quarter Fiscal Year 2018 Financial Highlights
- Revenue:
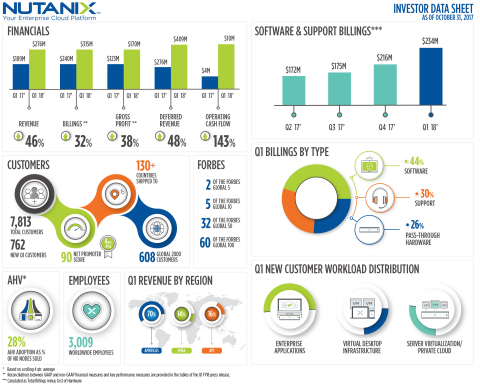
$275.6 million , growing 46% year-over-year from$188.6 million in the first quarter of fiscal 2017 - Billings:
$315.3 million , growing 32% year-over-year from$239.8 million in the first quarter of fiscal 2017 - Net Loss: GAAP net loss of
$61.5 million , compared to a GAAP net loss of$140.3 million in the first quarter of fiscal 2017; non-GAAP net loss of$24.7 million , compared to a non-GAAP net loss of$26.0 million in the first quarter of fiscal 2017 - Net Loss Per Share: GAAP net loss per share of
$0.39 , compared to a GAAP net loss per share of$1.89 and a pro forma GAAP net loss per share of$1.09 in the first quarter of fiscal 2017; non-GAAP net loss per share of$0.16 , compared to a pro forma non-GAAP net loss per share of$0.20 in the first quarter of fiscal 2017 - Cash and Short-term Investments:
$365.9 million , up 5% from the first quarter of fiscal 2017 - Deferred Revenue:
$408.8 million , up 48% from the first quarter of fiscal 2017 - Operating Cash Flow:
$10.1 million , compared to$4.2 million in the first quarter of fiscal 2017 - Free Cash Flow:
$(7.9) million , compared to$(7.8) million in the first quarter of fiscal 2017
Reconciliations between GAAP and non-GAAP financial measures and key performance measures are provided in the tables of this press release.
“We’re pleased to start our fiscal 2018 with a strong Q1 and a meaningful and engaging .NEXT conference in Europe,” said
Recent Company Highlights
- Continued Customer Growth:
Nutanix ended the first quarter of fiscal 2018 with 7,813 end-customers, adding over 760 new end-customers during the quarter. First quarter customer wins includedConocoPhillips ; JLL;Leonardo SpA ;Scholastic Inc. ; Shinsegae;Toyota Motor North America, Inc. andTrek Bicycle Corporation . - Increased Number of $1 Million+ Deals: 49 customers with deals over
$1 million in the quarter, up 36% YoY. - Unveiled New Features to Run More Workloads: New services announced at .NEXT
Europe 2017 address the unique needs of the diverse set of applications that enterprises need to deliver in a multi-cloud environment. The new Acropolis Object Storage Service, Acropolis Compute Cloud and Nutanix App Marketplace make it simple for IT teams to develop, test and run nearly any application within their enterprise clouds. - Received Strong Participation in 3rd Annual
Customer Conference inEurope : Largest-ever number of European attendees, including 1,085 customers and 670+ partners, joinedNutanix inNice, France for its .NEXTEurope conference to hear more about the company’s vision for the multi-cloud era. - Bolstered Board of Directors: Respected industry veterans
Sue Bostrom andCraig Conway joined theNutanix board, bringing with them a wealth of knowledge and expertise from companies includingCisco and Peoplesoft. - Hired Industry Leaders in Key Roles: Enhanced the executive team with the addition of
Lou Attanasio , Chief Revenue Officer;Tyler Wall , Chief Legal Officer;Inder Sidhu , EVP, Global Customer Success and Business Operations andSherry Lautenbach , SVP, Americas Sales.
“While we will be focusing even more intently on selling software going forward, it’s worth noting what the past twelve months would have looked like had we chosen not to bill any pass-through hardware-related transactions.
Q2 Fiscal 2018 Financial Outlook
For the second quarter of fiscal 2018,
- Revenues between
$280 and $285 million ; assuming the elimination of approximately$12 million in pass-through hardware sales; - Non-GAAP gross margin between 62.5% and 63.5%;
- Non-GAAP operating expenses of approximately
$210 million ; - Non-GAAP net loss per share between
$0.20 and $0.22 , using 161 million weighted shares outstanding.
Supplementary materials to this earnings release, including the company’s first quarter fiscal 2018 investor presentation, can be found at http://ir.nutanix.com/company/financial/.
All forward-looking non-GAAP financial measures contained in this section titled "Q2 Fiscal 2018 Financial Outlook" exclude stock-based compensation expense and amortization of intangible assets and may also exclude, as applicable, other special items. The company has not reconciled guidance for non-GAAP gross margin and non-GAAP loss per share to their most directly comparable GAAP measures because such items that impact these measures are not within its control and are subject to constant change. While the actual amounts of such items will have a significant impact on the company’s non-GAAP gross margin and non-GAAP loss per share, a reconciliation of the non-GAAP financial measure guidance to the corresponding GAAP measures is not available without unreasonable effort.
|
(1) |
Pure software and support billings during the last twelve months of nearly $800 million is calculated as billings, less direct hardware costs of approximately $268 million for the last twelve months. | |
|
(2) |
Pure software and support gross margin of above 80% is calculated using non-GAAP gross profit divided by revenue, adjusted to exclude direct hardware costs for the last twelve months. |
Webcast and Conference Call Information
New Accounting Standard
The Company adopted ASC 606, the new standard related to revenue recognition effective
Non-GAAP Financial Measures and Other Key Performance Measures
To supplement our condensed consolidated financial statements, which are prepared and presented in accordance with GAAP, we use the following non-GAAP financial and other key performance measures: billings, non-GAAP gross margin percentage, non-GAAP operating expenses, non-GAAP net loss, pro forma non-GAAP net loss per share, and free cash flow. In computing these non-GAAP financial measures, we exclude certain items such as stock-based compensation and the related income tax impact, costs associated with our acquisitions (such as amortization of acquired intangible assets, revaluation of contingent consideration, income tax-related impact, and other acquisition-related costs), loss on debt extinguishment, and changes in the fair value of our preferred stock warrant liability. Billings is a performance measure which our management believes provides useful information to investors because it represents the amounts under binding purchase orders received by us during a given period that have been billed, and we calculate billings by adding the change in deferred revenue between the start and end of the period to total revenue recognized in the same period. Free cash flow is a performance measure that our management believes provides useful information to management and investors about the amount of cash generated by the business after necessary capital expenditures, and we define free cash flow as net cash (used in) provided by operating activities less purchases of property and equipment. Adjusted gross margin percentage and non-GAAP operating expense are performance measures which our management believes provides useful information to investors because they provide meaningful supplemental information regarding our performance and liquidity by excluding certain expenses and expenditures such as stock-based compensation expense that may not be indicative of our ongoing core business operating results. We use these non-GAAP financial and key performance measures for financial and operational decision-making and as a means to evaluate period-to-period comparisons. However, these non-GAAP financial and key performance measures have limitations as analytical tools and you should not consider them in isolation or as substitutes for analysis of our results as reported under GAAP. Billings, non-GAAP gross margin percentage, non-GAAP operating expenses, non-GAAP net loss, pro forma non-GAAP net loss per share, and free cash flow are not substitutes for total revenue, gross margin percentage, operating expenses, net loss, net loss per share, or net cash (used in) provided by operating activities, respectively. In addition, other companies, including companies in our industry, may calculate non-GAAP financial measures and key performance measures differently or may use other measures to evaluate their performance, all of which could reduce the usefulness of our non-GAAP financial measures and key performance measures as tools for comparison. We urge you to review the reconciliation of our non-GAAP financial measures and key performance measures to the most directly comparable GAAP financial measures included below in the tables captioned “Reconciliation of Revenue to Billings,” “Reconciliation of GAAP to Non-GAAP Profit Measures,” and “Reconciliation of GAAP Net Cash (Used In) Provided By Operating Activities to Non-GAAP Free Cash Flow,” and not to rely on any single financial measure to evaluate our business.
Forward Looking Statements
This press release contains express and implied forward-looking statements, including but not limited to statements relating to our competitive differentiation, our plans and expectations relating to product sales and shifts in the mix of whether our solutions are sold as an appliance or as software-only, our plans and expectations regarding product features and technology that are under development or in process, and capabilities of such product features and technology, our plans to introduce product features in future releases, and anticipated future financial results, including but not limited to our guidance on estimated revenues, non-GAAP gross margin, non-GAAP operating expenses and non-GAAP net loss per share for future fiscal periods. These forward-looking statements are not historical facts and instead are based on our current expectations, estimates, opinions, and beliefs. Consequently, you should not rely on these forward-looking statements. The accuracy of such forward-looking statements depends upon future events and involves risks, uncertainties, and other factors beyond our control that may cause these statements to be inaccurate and cause our actual results, performance or achievements to differ materially and adversely from those anticipated or implied by such statements, including, among others: failure to develop, or unexpected difficulties or delays in developing, new product features or technology on a timely or cost-effective basis; delays in or lack of customer or market acceptance of our new product features or technology; the failure of our software to interoperate on different hardware platforms; delays in the formation of new strategic partnerships and the possibility that we may not receive anticipated results from forming such strategic partnerships; delays in the transition to focus primarily on software-only transactions; the rapid evolution of the markets in which we compete; our ability to sustain or manage future growth effectively; factors that could result in the significant fluctuation of our future quarterly operating results, including, among other things, anticipated changes to our revenue and product mix which will slow revenue growth during such transition and make forecasting future performance more difficult, the timing and magnitude of orders, shipments and acceptance of our solutions in any given quarter, our ability to attract new and retain existing end-customers, changes in the pricing of certain components of our solutions, and fluctuations in demand and competitive pricing pressures for our solutions; the introduction, or acceleration of adoption of, competing solutions, including public cloud infrastructure; failure to develop, or unexpected difficulties or delays in developing, new product features or technology on a timely or cost-effective basis; and other risks detailed in our Annual Report on Form 10-K for the year ended
About
© 2017
| NUTANIX, INC. | ||||||||||
| CONDENSED CONSOLIDATED BALANCE SHEETS | ||||||||||
| (In thousands, unaudited) | ||||||||||
| As of | ||||||||||
| July 31, | October 31, | |||||||||
| 2017 | 2017 | |||||||||
| Assets | ||||||||||
| Current assets: | ||||||||||
| Cash and cash equivalents | $ | 138,359 | $ | 132,459 | ||||||
| Short-term investments | 210,694 | 233,486 | ||||||||
| Accounts receivable—net | 178,876 | 171,550 | ||||||||
| Deferred commissions—current | 23,843 | 26,464 | ||||||||
| Prepaid expenses and other current assets | 28,362 | 28,942 | ||||||||
| Total current assets | 580,134 | 592,901 | ||||||||
| Property and equipment—net | 58,072 | 67,575 | ||||||||
| Deferred commissions—non-current | 49,684 | 55,520 | ||||||||
| Intangible assets—net | 26,001 | 24,895 | ||||||||
| Goodwill | 16,672 | 16,672 | ||||||||
| Other assets—non-current | 7,649 | 7,347 | ||||||||
| Total assets | $ | 738,212 | $ | 764,910 | ||||||
| Liabilities, Convertible Preferred Stock and Stockholders’ Equity | ||||||||||
| Current liabilities: | ||||||||||
| Accounts payable | $ | 73,725 | $ | 68,629 | ||||||
| Accrued compensation and benefits | 57,521 | 50,301 | ||||||||
| Accrued expenses and other liabilities | 9,707 | 9,431 | ||||||||
| Deferred revenue—current | 170,123 | 190,592 | ||||||||
| Total current liabilities | 311,076 | 318,953 | ||||||||
| Deferred revenue—non-current | 198,933 | 218,252 | ||||||||
| Early exercised stock options liability | 851 | 571 | ||||||||
| Other liabilities—non-current | 10,289 | 10,554 | ||||||||
| Total liabilities | 521,149 | 548,330 | ||||||||
| Commitments and contingencies | ||||||||||
| Stockholders’ equity: | ||||||||||
| Common stock | 4 | 4 | ||||||||
| Additional paid-in capital | 948,134 | 1,009,268 | ||||||||
| Accumulated other comprehensive loss | (106 | ) | (236 | ) | ||||||
| Accumulated deficit | (730,969 | ) | (792,456 | ) | ||||||
| Total stockholders’ equity | 217,063 | 216,580 | ||||||||
| Total liabilities and stockholders’ equity | $ | 738,212 | $ | 764,910 | ||||||
| NUTANIX, INC. | ||||||||||
| CONDENSED CONSOLIDATED STATEMENTS OF OPERATIONS | ||||||||||
| (In thousands, except share and per share data, unaudited) | ||||||||||
| Three Months Ended | ||||||||||
| October 31, | ||||||||||
| 2016 | 2017 | |||||||||
| Revenue: | ||||||||||
| Product | $ | 153,536 | $ | 219,052 | ||||||
| Support and other services | 35,025 | 56,500 | ||||||||
|
Total revenue |
188,561 | 275,552 | ||||||||
| Cost of revenue: | ||||||||||
| Product (1)(2) | 52,210 | 85,162 | ||||||||
| Support and other services (1) | 17,552 | 23,460 | ||||||||
| Total cost of revenue | 69,762 | 108,622 | ||||||||
| Gross profit | 118,799 | 166,930 | ||||||||
| Operating expenses: | ||||||||||
| Sales and marketing (1)(2) | 128,625 | 145,405 | ||||||||
| Research and development (1) | 75,281 | 64,512 | ||||||||
| General and administrative (1) | 29,372 | 16,052 | ||||||||
| Total operating expenses | 233,278 | 225,969 | ||||||||
| Loss from operations | (114,479 | ) | (59,039 | ) | ||||||
| Other expense—net | (25,712 | ) | (189 | ) | ||||||
| Loss before provision for income taxes | (140,191 | ) | (59,228 | ) | ||||||
| Provision for income taxes | 111 | 2,259 | ||||||||
| Net loss | $ | (140,302 | ) | $ | (61,487 | ) | ||||
| Net loss per share attributable to Class A and Class B common stockholders—basic and diluted | $ | (1.89 | ) | $ | (0.39 | ) | ||||
| Weighted-average shares used in computing net loss per share attributable to Class A and Class B common stockholders—basic and diluted | 74,373,788 | 156,780,631 | ||||||||
|
(1) Includes the following stock-based compensation expense: |
|||||||||
| Three Months Ended | |||||||||
| October 31, | |||||||||
| 2016 | 2017 | ||||||||
| (in thousands) | |||||||||
| Product cost of sales | $ | 966 | $ | 570 | |||||
| Support cost of sales | 3,350 | 2,072 | |||||||
| Sales and marketing | 33,891 | 13,766 | |||||||
| Research and development | 34,026 | 15,542 | |||||||
| General and administrative | 18,495 | 3,565 | |||||||
|
Total stock-based compensation expense |
$ | 90,728 | $ | 35,515 | |||||
|
(2) Includes the following amortization of intangible assets: |
|||||||||
| Three Months Ended | |||||||||
| October 31, | |||||||||
| 2016 | 2017 | ||||||||
| (in thousands) | |||||||||
| Product cost of sales | $ | 238 | $ | 895 | |||||
| Sales and marketing | 167 | 211 | |||||||
| Total amortization of intangible assets | $ | 405 | $ | 1,106 | |||||
| NUTANIX, INC. | ||||||||||
| CONDENSED CONSOLIDATED STATEMENTS OF CASH FLOWS | ||||||||||
| (In thousands, unaudited) | ||||||||||
| Three Months Ended | ||||||||||
| October 31, | ||||||||||
| 2016 | 2017 | |||||||||
| Cash flows from operating activities: | ||||||||||
| Net loss | $ | (140,302 | ) | $ | (61,487 | ) | ||||
| Adjustments to reconcile net loss to net cash provided by operating activities: | ||||||||||
| Depreciation and amortization | 8,572 | 11,333 | ||||||||
| Stock-based compensation | 90,728 | 35,515 | ||||||||
| Loss on debt extinguishment | 3,320 | — | ||||||||
| Change in fair value of convertible preferred stock warrant liability | 21,133 | — | ||||||||
| Change in fair value of contingent consideration | 186 | 282 | ||||||||
| Other | 183 | 131 | ||||||||
| Changes in operating assets and liabilities: | ||||||||||
| Accounts receivable—net | (36,213 | ) | 7,326 | |||||||
| Deferred commission | (4,780 | ) | (8,457 | ) | ||||||
| Prepaid expenses and other assets | 840 | (307 | ) | |||||||
| Accounts payable | 5,052 | (6,504 | ) | |||||||
| Accrued compensation and benefits | 3,518 | (7,220 | ) | |||||||
| Accrued expenses and other liabilities | 717 | (293 | ) | |||||||
| Deferred revenue | 51,206 | 39,788 | ||||||||
| Net cash provided by operating activities | 4,160 | 10,107 | ||||||||
| Cash flows from investing activities: | ||||||||||
| Purchases of property and equipment | (11,915 | ) | (17,965 | ) | ||||||
| Purchases of investments | (87,448 | ) | (59,108 | ) | ||||||
| Maturities of investments | 19,950 | 35,920 | ||||||||
| Sale of investments | 31,638 | — | ||||||||
| Payments for business acquisitions, net of cash acquired | (184 | ) | — | |||||||
| Net cash used in investing activities | (47,959 | ) | (41,153 | ) | ||||||
| Cash flows from financing activities: | ||||||||||
| Proceeds from sales of shares through employee equity incentive plans, net of repurchases | 1,472 | 25,231 | ||||||||
| Proceeds from initial public offering, net of underwriting discounts and commissions | 254,455 | — | ||||||||
| Payments of offering costs, net | (2,243 | ) | (85 | ) | ||||||
| Repayment of senior notes | (75,000 | ) | — | |||||||
| Debt extinguishment costs | (1,580 | ) | — | |||||||
| Payment of debt in conjunction with a business acquisition | (7,124 | ) | — | |||||||
| Other | 73 | — | ||||||||
| Net cash provided by financing activities | 170,053 | 25,146 | ||||||||
| Net increase (decrease) in cash and cash equivalents | 126,254 | (5,900 | ) | |||||||
| Cash and cash equivalents—beginning of period | 99,209 | 138,359 | ||||||||
| Cash and cash equivalents—end of period | $ | 225,463 | $ | 132,459 | ||||||
| Supplemental disclosures of cash flow information: | ||||||||||
| Cash paid for income taxes | $ | 698 | $ | 2,066 | ||||||
| Cash paid for interest | $ | 1,271 | $ | — | ||||||
| Supplemental disclosures of non-cash investing and financing information: | ||||||||||
| Purchases of property and equipment included in accounts payable | $ | 5,033 | $ | 7,084 | ||||||
| Vesting of early exercised stock options | $ | 499 | $ | 249 | ||||||
| Offering costs included in accounts payable | $ | 367 | $ | — | ||||||
| Conversion of convertible preferred stock to common stock, net of issuance costs | $ | 310,379 | $ | — | ||||||
| Reclassification of convertible preferred stock warrant liability to additional paid-in capital | $ | 30,812 | $ | — | ||||||
| Issuance of common stock for business acquisitions | $ | 27,063 | $ | — | ||||||
| Reconciliation of Revenue to Billings | |||||||||
| (In thousands, unaudited) | |||||||||
| Three Months Ended | |||||||||
| October 31, | |||||||||
| 2016 | 2017 | ||||||||
| Total revenue | $ | 188,561 | $ | 275,552 | |||||
| Change in deferred revenue, net of acquisitions (1) | 51,206 | 39,788 | |||||||
| Billings | $ | 239,767 | $ | 315,340 | |||||
|
(1) Three months ended October 31, 2016 excluded approximately $6.0 million of deferred revenue assumed in the PernixData acquisition. |
|||||||||
| Reconciliation of GAAP to Non-GAAP Profit Measures | ||||||||||||||||||||||||||||||
| (In thousands, except share and per share data, unaudited) | ||||||||||||||||||||||||||||||
| GAAP | Non-GAAP Adjustments | Non-GAAP | ||||||||||||||||||||||||||||
| Three Months | Three Months | |||||||||||||||||||||||||||||
| Ended | Ended | |||||||||||||||||||||||||||||
| October 31, | October 31, | |||||||||||||||||||||||||||||
| 2017 | (1) | (2) | (3) | (4) | 2017 | |||||||||||||||||||||||||
| Gross profit | $ | 166,930 | $ | 2,642 | $ | 895 | $ | — | $ | — | $ | 170,467 | ||||||||||||||||||
|
Gross margin |
60.6 |
% |
1.0 |
% |
0.3 | % | — | — | 61.9 | % | ||||||||||||||||||||
| Operating expenses: | ||||||||||||||||||||||||||||||
| Sales and marketing | 145,405 | (13,766 | ) | (211 | ) | — | — | 131,428 | ||||||||||||||||||||||
| Research and development | 64,512 | (15,542 | ) | — | — | — | 48,970 | |||||||||||||||||||||||
| General and administrative | 16,052 | (3,565 | ) | — | (282 | ) | — | 12,205 | ||||||||||||||||||||||
| Total operating expenses | 225,969 | (32,873 | ) | (211 | ) | (282 | ) | — | 192,603 | |||||||||||||||||||||
| Loss from operations | (59,039 |
) |
35,515 | 1,106 | 282 | — | (22,136 | ) | ||||||||||||||||||||||
| Net loss | $ | (61,487 | ) | $ | 35,515 | $ | 1,106 | $ | 282 | $ | (132 | ) | $ | (24,716 | ) | |||||||||||||||
| Weighted-shares outstanding, basic and diluted | 156,780,631 | 156,780,631 | ||||||||||||||||||||||||||||
| Net loss per share, basic and diluted | $ | (0.39 | ) | $ | 0.23 | $ | — | $ | — | $ | — | $ | (0.16 | ) | ||||||||||||||||
|
(1) Stock-based compensation expense |
||||||||||||||||||||||||||||||
|
(2) Amortization of intangible assets |
||||||||||||||||||||||||||||||
|
(3) Change in fair value of contingent consideration assumed in the PernixData acquisition |
||||||||||||||||||||||||||||||
|
(4) Income tax effect primarily related to stock-based compensation expense |
||||||||||||||||||||||||||||||
| GAAP | Non-GAAP Adjustments | Non-GAAP | |||||||||||||||||||||||||||||||||||||||||||
| Three Months | Three Months | ||||||||||||||||||||||||||||||||||||||||||||
| Ended | Ended | ||||||||||||||||||||||||||||||||||||||||||||
| October 31, | October 31, | ||||||||||||||||||||||||||||||||||||||||||||
| 2016 | (1) | (2) | (3) | (4) | (5) | (6) | (7) | 2016 | |||||||||||||||||||||||||||||||||||||
| Gross profit | $ | 118,799 | $ | 4,316 | $ | 238 | $ | — | $ | — | $ | — | $ | — | $ | — | $ | 123,353 | |||||||||||||||||||||||||||
| Gross margin | 63.0 | % | 2.3 | % | 0.1 | % | — | — | — | — | — | 65.4 | % | ||||||||||||||||||||||||||||||||
| Operating expenses: | |||||||||||||||||||||||||||||||||||||||||||||
| Sales and marketing | 128,625 | (33,891 | ) | (167 | ) | — | — | — | — | — | 94,567 | ||||||||||||||||||||||||||||||||||
| Research and development | 75,281 | (34,026 | ) | — | — | — | — | — | — | 41,255 | |||||||||||||||||||||||||||||||||||
| General and administrative | 29,372 | (18,495 | ) | — | (672 | ) | (186 | ) | — | — | — | 10,019 | |||||||||||||||||||||||||||||||||
| Total operating expenses | 233,278 | (86,412 | ) | (167 | ) | (672 | ) | (186 | ) | — | — | — | 145,841 | ||||||||||||||||||||||||||||||||
| Loss from operations | (114,479 | ) | 90,728 | 405 | 672 | 186 | — | — | — | (22,488 | ) | ||||||||||||||||||||||||||||||||||
| Net loss | $ | (140,302 | ) | $ | 90,728 | $ | 405 | $ | 672 | $ | 186 | $ | 21,133 | $ | 3,320 | $ | (2,109 | ) | $ | (25,967 | ) | ||||||||||||||||||||||||
| Weighted-shares outstanding, basic and diluted | 74,373,788 | 74,373,788 | |||||||||||||||||||||||||||||||||||||||||||
| Pro forma adjustment | 53,921,394 | 53,921,394 | |||||||||||||||||||||||||||||||||||||||||||
| Pro forma weighted-shares outstanding, basic and diluted | 128,295,182 | 128,295,182 | |||||||||||||||||||||||||||||||||||||||||||
| Net loss per share, basic and diluted | $ | (1.89 | ) | ||||||||||||||||||||||||||||||||||||||||||
|
Pro forma net loss per share, basic and diluted * |
$ | (1.09 | ) | $ | 0.71 | $ | — | $ | 0.01 | $ | — | $ | 0.16 | $ | 0.03 | $ | (0.02 | ) | $ | (0.20 | ) | ||||||||||||||||||||||||
|
(1) Stock-based compensation expense |
|||||||||||||||||||||||||||||||||||||||||||||
|
(2) Amortization of intangible assets |
|||||||||||||||||||||||||||||||||||||||||||||
|
(3) Acquisition-related costs |
|||||||||||||||||||||||||||||||||||||||||||||
|
(4) Change in fair value of contingent consideration assumed in the PernixData acquisition |
|||||||||||||||||||||||||||||||||||||||||||||
|
(5) Change in fair value of preferred stock warrant liability |
|||||||||||||||||||||||||||||||||||||||||||||
|
(6) Loss on debt extinguishment |
|||||||||||||||||||||||||||||||||||||||||||||
|
(7) Partial release of valuation allowance from the PernixData acquisition and the tax effect of stock-based compensation expense |
|||||||||||||||||||||||||||||||||||||||||||||
|
|
|||||||||||||||||||||||||||||||||||||||||||||
|
*Pro forma non-GAAP basic and diluted net loss per share was computed to give effect to the conversion of all outstanding convertible preferred stock upon closing of our initial public offering on October 5, 2016, as if the conversion had occurred at the beginning of the period. |
|||||||||||||||||||||||||||||||||||||||||||||
| Reconciliation of GAAP Net Cash Provided By Operating Activities to Non-GAAP Free Cash Flow | ||||||||||
| (In thousands, unaudited) | ||||||||||
| Three Months Ended | ||||||||||
| October 31, | ||||||||||
| 2016 | 2017 | |||||||||
| Net cash provided by operating activities | $ | 4,160 | $ | 10,107 | ||||||
| Purchase of property and equipment | (11,915 | ) | (17,965 | ) | ||||||
| Free cash flow | $ | (7,755 | ) | $ | (7,858 | ) | ||||
View source version on businesswire.com: http://www.businesswire.com/news/home/20171130006043/en/
Source:
Nutanix, Inc.
Investor Contact:
Tonya Chin, 408-560-2675
tonya@nutanix.com
or
Media Contact:
Kate Reed, 973-534-9292
kreed@nutanix.com